| Param | Original file | Final file |
|---|---|---|
| Filename | modeM0/AS1G08_044T01_9000001658cztM0_level2.evt | modeM0/AS1G08_044T01_9000001658cztM0_level2_quad_clean.evt |
| Size (bytes) | 1,458,936,000 | 197,415,360 |
| Size | 1.4 GB | 188.3 MB |
| Events in quadrant A | 8,729,955 | 1,266,616 |
| Events in quadrant B | 11,745,258 | 1,244,681 |
| Events in quadrant C | 7,156,445 | 1,282,778 |
| Events in quadrant D | 15,490,923 | 1,097,979 |
| Mode SS | |||
|---|---|---|---|
| Quadrant | BADHDUFLAG | Total packets | Discarded packets |
| A | 0 | 320 | 0 |
| B | 0 | 320 | 0 |
| C | 0 | 320 | 0 |
| D | 0 | 320 | 0 |
| Mode M0 | |||
|---|---|---|---|
| Quadrant | BADHDUFLAG | Total packets | Discarded packets |
| A | 0 | 35913 | 0 |
| B | 0 | 44863 | 0 |
| C | 0 | 32270 | 0 |
| D | 0 | 56530 | 0 |
| Mode M9 | |||
|---|---|---|---|
| Quadrant | BADHDUFLAG | Total packets | Discarded packets |
| A | 0 | 20 | 0 |
| B | 0 | 20 | 0 |
| C | 0 | 20 | 0 |
| D | 0 | 20 | 0 |
| Quadrant | Total seconds | Saturated seconds | Saturation percentage |
|---|---|---|---|
| A | 15740 | 489 | 3.106734% |
| B | 15740 | 1403 | 8.913596% |
| C | 15740 | 132 | 0.838628% |
| D | 15740 | 2582 | 16.404066% |
Noise dominated data is calculated using 1-second bins in cleaned event files. If a bin has >2000 counts, and if more than 50% of those come from <1% of pixels, then it is considered to be noise-dominated and hence unusable.
| Quadrant | # 1 sec bins | Bins with >0 counts | Bins with >2000 counts | High rate bins dominated by noise | Noise dominated (total time) | Noise dominated (detector-on time) | Marked lightcurve |
|---|---|---|---|---|---|---|---|
| A | 17690 | 15743 | 183 | 183 | 1.03% | 1.16% |  |
| B | 17690 | 15743 | 843 | 843 | 4.77% | 5.35% |  |
| C | 17690 | 15743 | 4 | 4 | 0.02% | 0.03% |  |
| D | 17690 | 15743 | 2387 | 2387 | 13.49% | 15.16% |  |
Top three noisy pixels from each quadrant. If the there are fewer than three noisy pixels in the level2.evt file, extra rows are filled as -1
| Pixel properties | Quadrant properties | ||||||
|---|---|---|---|---|---|---|---|
| Quadrant | DetID | PixID | Counts | Sigma | Mean | Median | Sigma |
| A | 14 | 238 | 816281 | 2158.81 | 1844 | 1799 | 377.3 |
| A | 8 | 15 | 614526 | 1624.05 | 1844 | 1799 | 377.3 |
| A | 15 | 174 | 66110 | 170.46 | 1844 | 1799 | 377.3 |
| B | 4 | 239 | 2270767 | 6491.58 | 1810 | 1763 | 349.5 |
| B | 3 | 64 | 1876651 | 5364.02 | 1810 | 1763 | 349.5 |
| B | 15 | 204 | 171897 | 486.75 | 1810 | 1763 | 349.5 |
| C | 9 | 204 | 80643 | 187.55 | 1807 | 1815 | 420.3 |
| C | 14 | 234 | 16171 | 34.16 | 1807 | 1815 | 420.3 |
| C | 13 | 61 | 13344 | 27.43 | 1807 | 1815 | 420.3 |
| D | 13 | 152 | 2571938 | 6280.21 | 1687 | 1640 | 409.3 |
| D | 7 | 80 | 2481532 | 6059.31 | 1687 | 1640 | 409.3 |
| D | 1 | 52 | 1507596 | 3679.62 | 1687 | 1640 | 409.3 |
Histogram calculated using DETX and DETY for each event in the final _common_clean file
| Quadrant A | 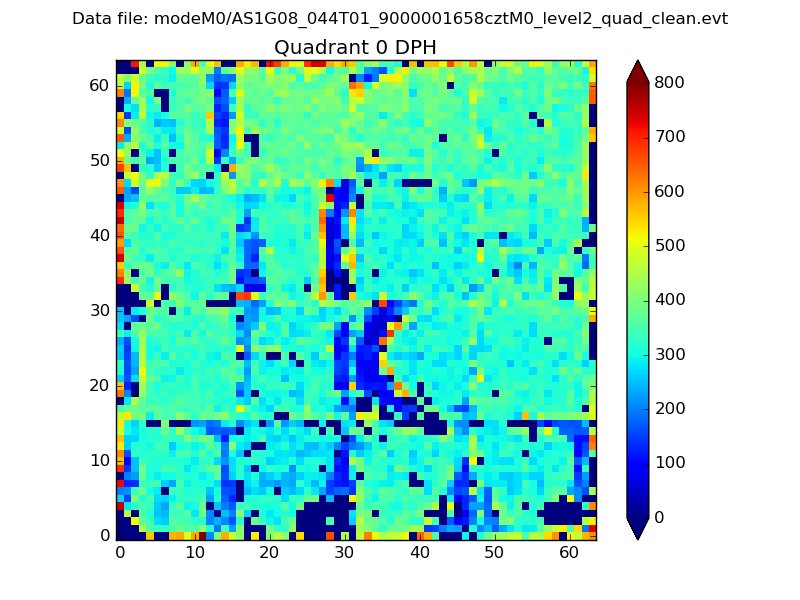 |
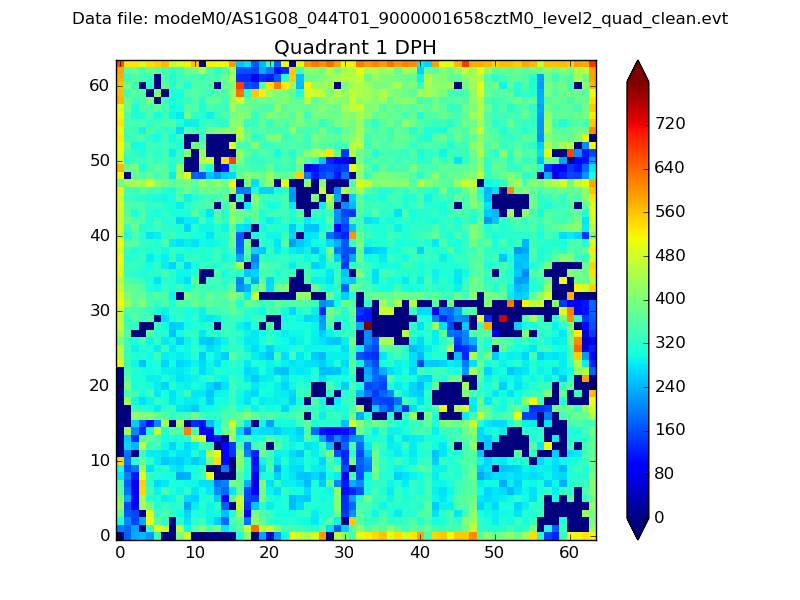 |
Quadrant B |
|---|---|---|---|
| Quadrant D | 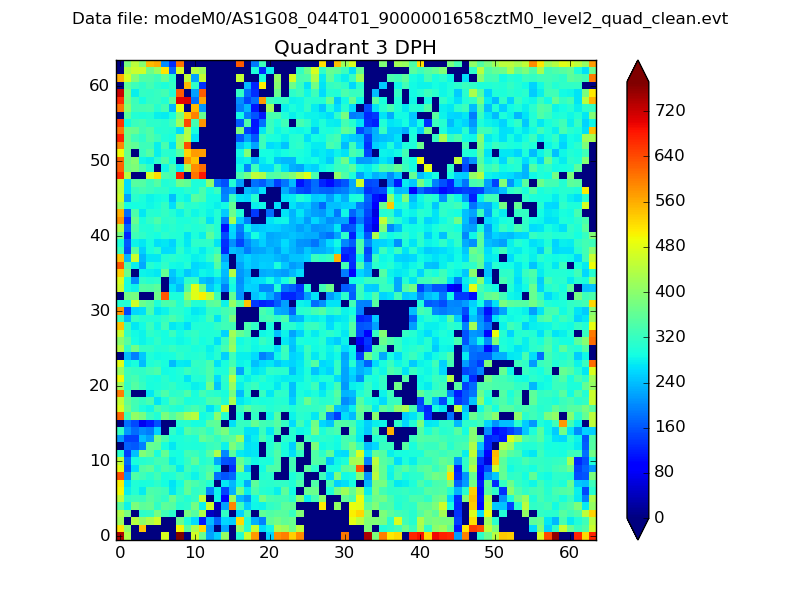 |
 |
Quadrant C |
| Plot type | Count rate plots | Images |
|---|---|---|
| Comparison with Poisson distribution Blue bars denote a histogram of data divided into 1 sec bins. Red curve is a Poisson curve with rate = median count rate of data. |
 |
 |
| Quadrant-wise count rates Data is divided into 100 sec bins |
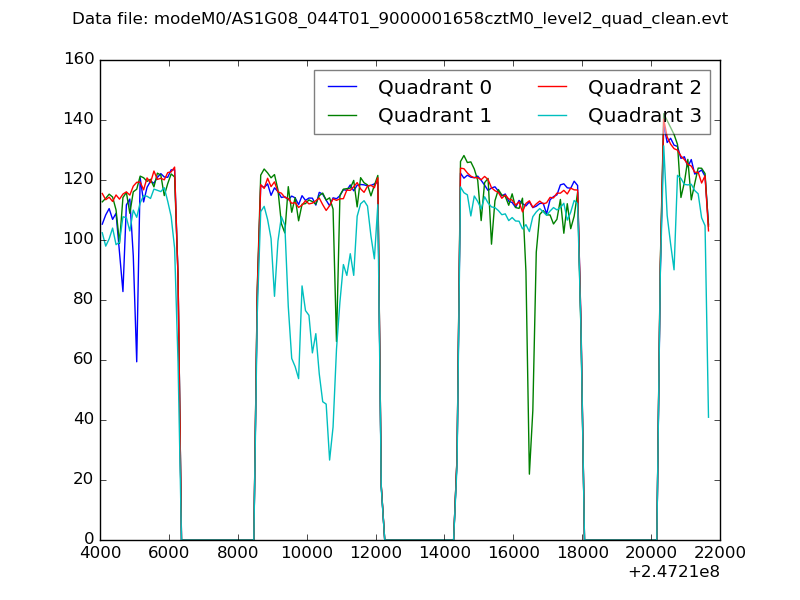 |
|
| Module-wise count rates for Quadrant A Data is divided into 100 sec bins |
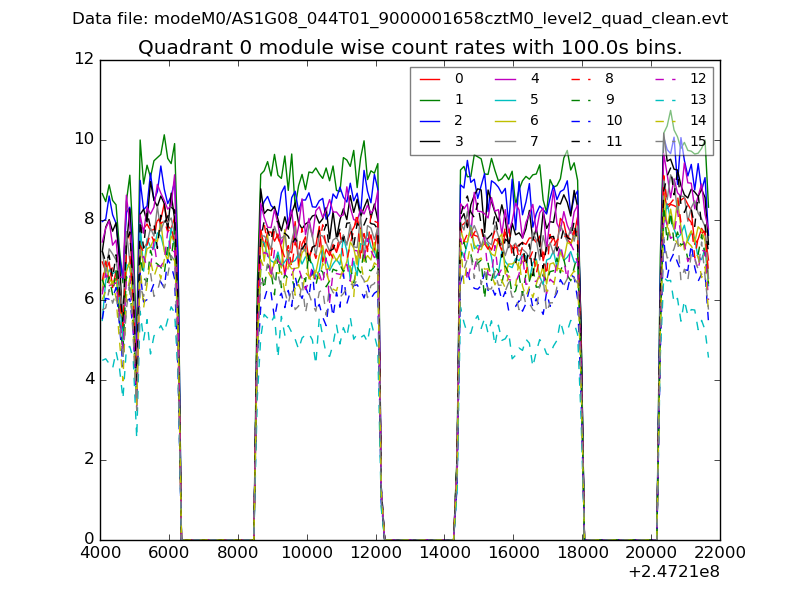 |
 |
| Module-wise count rates for Quadrant B Data is divided into 100 sec bins |
 |
 |
| Module-wise count rates for Quadrant C Data is divided into 100 sec bins |
 |
 |
| Module-wise count rates for Quadrant D Data is divided into 100 sec bins |
 |
 |
| Parameter | Plot |
|---|---|
| CZT HV Monitor | 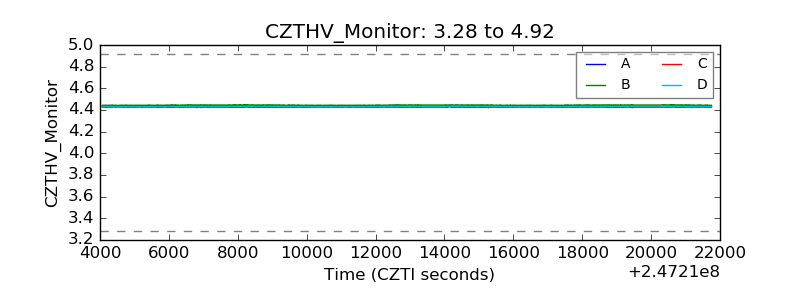 |
| D_VDD |  |
| Temperature 1 |  |
| Veto HV Monitor |  |
| Veto LLD |  |
| Alpha Counter |  |
| _CPM_Rate |  |
| CZT Counter |  |
| +2.5 Volts monitor |  |
| +5 Volts monitor |  |
| _ROLL_ROT |  |
| _Roll_DEC |  |
| _Roll_RA | 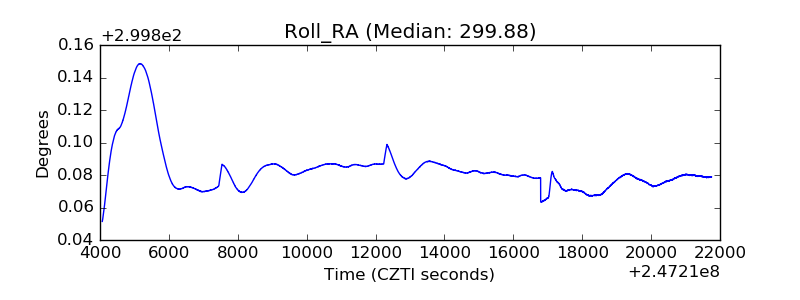 |
| Veto Counter |  |