| Param | Original file | Final file |
|---|---|---|
| Filename | modeM0/AS1G08_028T01_9000001656cztM0_level2.evt | modeM0/AS1G08_028T01_9000001656cztM0_level2_quad_clean.evt |
| Size (bytes) | 3,869,164,800 | 425,338,560 |
| Size | 3.6 GB | 405.6 MB |
| Events in quadrant A | 34,190,312 | 2,478,492 |
| Events in quadrant B | 24,107,909 | 2,707,983 |
| Events in quadrant C | 23,839,045 | 2,638,718 |
| Events in quadrant D | 32,487,349 | 2,446,010 |
| Mode SS | |||
|---|---|---|---|
| Quadrant | BADHDUFLAG | Total packets | Discarded packets |
| A | 0 | 770 | 0 |
| B | 0 | 770 | 0 |
| C | 0 | 770 | 0 |
| D | 0 | 770 | 0 |
| Mode M0 | |||
|---|---|---|---|
| Quadrant | BADHDUFLAG | Total packets | Discarded packets |
| A | 0 | 126185 | 0 |
| B | 0 | 96086 | 0 |
| C | 0 | 96394 | 0 |
| D | 0 | 122029 | 0 |
| Mode M9 | |||
|---|---|---|---|
| Quadrant | BADHDUFLAG | Total packets | Discarded packets |
| A | 0 | 54 | 0 |
| B | 0 | 54 | 0 |
| C | 0 | 54 | 0 |
| D | 0 | 54 | 0 |
| Quadrant | Total seconds | Saturated seconds | Saturation percentage |
|---|---|---|---|
| A | 37985 | 6749 | 17.767540% |
| B | 37985 | 2168 | 5.707516% |
| C | 37985 | 2625 | 6.910623% |
| D | 37985 | 4225 | 11.122812% |
Noise dominated data is calculated using 1-second bins in cleaned event files. If a bin has >2000 counts, and if more than 50% of those come from <1% of pixels, then it is considered to be noise-dominated and hence unusable.
| Quadrant | # 1 sec bins | Bins with >0 counts | Bins with >2000 counts | High rate bins dominated by noise | Noise dominated (total time) | Noise dominated (detector-on time) | Marked lightcurve |
|---|---|---|---|---|---|---|---|
| A | 43315 | 37991 | 4048 | 4048 | 9.35% | 10.66% |  |
| B | 43315 | 37992 | 831 | 831 | 1.92% | 2.19% |  |
| C | 43315 | 37992 | 1877 | 1877 | 4.33% | 4.94% |  |
| D | 43315 | 37990 | 3255 | 3255 | 7.51% | 8.57% | 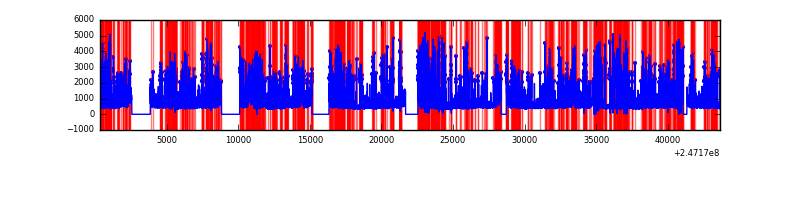 |
Top three noisy pixels from each quadrant. If the there are fewer than three noisy pixels in the level2.evt file, extra rows are filled as -1
| Pixel properties | Quadrant properties | ||||||
|---|---|---|---|---|---|---|---|
| Quadrant | DetID | PixID | Counts | Sigma | Mean | Median | Sigma |
| A | 14 | 238 | 14802906 | 17183.42 | 4218 | 4132 | 861.2 |
| A | 8 | 5 | 1650713 | 1911.91 | 4218 | 4132 | 861.2 |
| A | 1 | 162 | 321959 | 369.04 | 4218 | 4132 | 861.2 |
| B | 4 | 239 | 4604015 | 5235.19 | 4611 | 4490 | 878.6 |
| B | 3 | 64 | 549080 | 619.85 | 4611 | 4490 | 878.6 |
| B | 3 | 189 | 273014 | 305.63 | 4611 | 4490 | 878.6 |
| C | 9 | 204 | 6552787 | 6396.67 | 4417 | 4444 | 1023.7 |
| C | 13 | 61 | 32916 | 27.81 | 4417 | 4444 | 1023.7 |
| C | 9 | 54 | 26131 | 21.18 | 4417 | 4444 | 1023.7 |
| D | 10 | 253 | 5211766 | 5094.77 | 4233 | 4115 | 1022.2 |
| D | 7 | 80 | 4220576 | 4125.06 | 4233 | 4115 | 1022.2 |
| D | 1 | 52 | 2773857 | 2709.7 | 4233 | 4115 | 1022.2 |
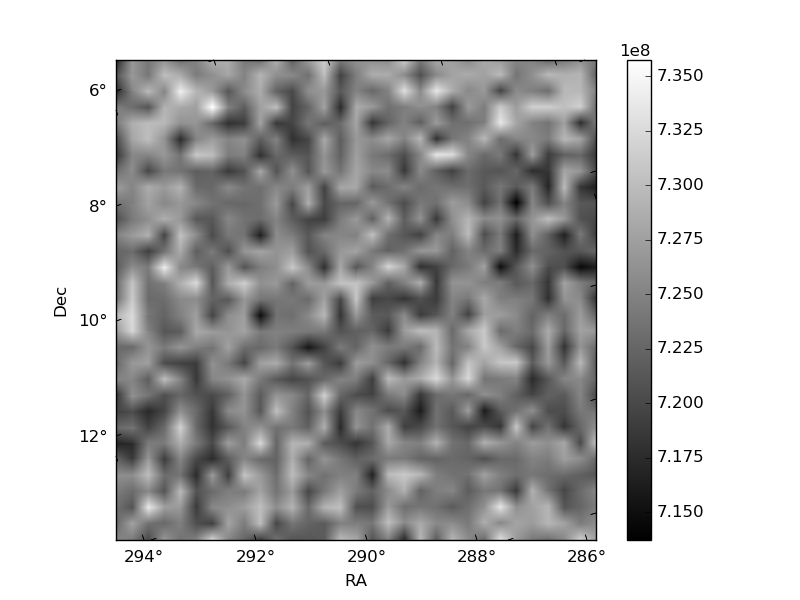
Histogram calculated using DETX and DETY for each event in the final _common_clean file
| Quadrant A |  |
 |
Quadrant B |
|---|---|---|---|
| Quadrant D |  |
 |
Quadrant C |
| Plot type | Count rate plots | Images |
|---|---|---|
| Comparison with Poisson distribution Blue bars denote a histogram of data divided into 1 sec bins. Red curve is a Poisson curve with rate = median count rate of data. |
 |
 |
| Quadrant-wise count rates Data is divided into 100 sec bins |
 |
|
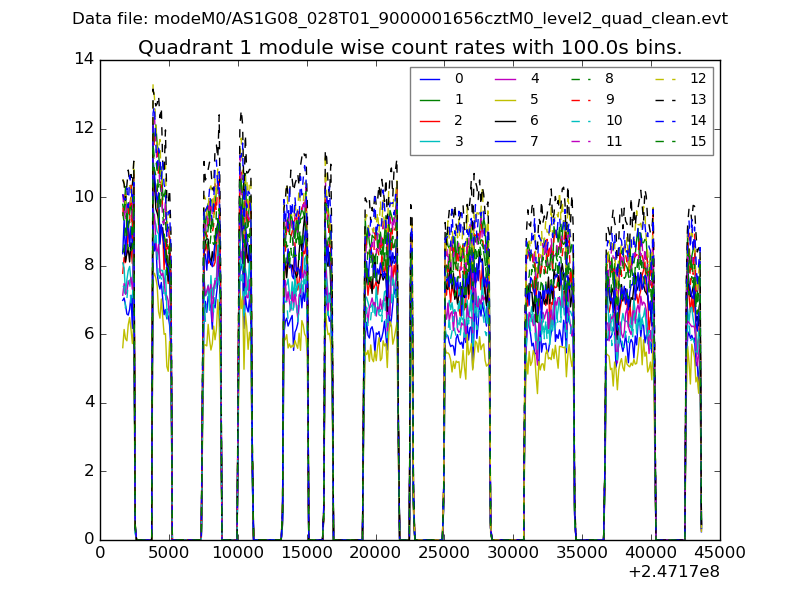
| Module-wise count rates for Quadrant A Data is divided into 100 sec bins |
 |
 |
| Module-wise count rates for Quadrant B Data is divided into 100 sec bins |
 |
 |
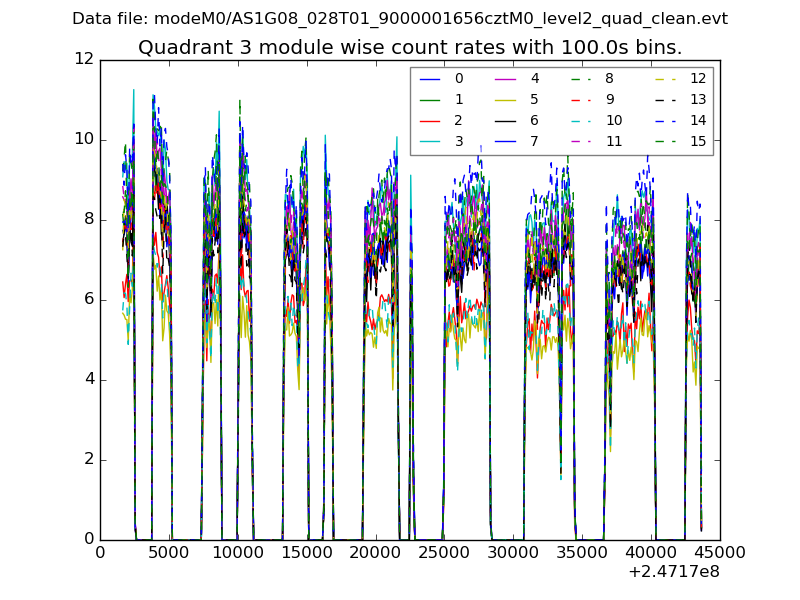
| Module-wise count rates for Quadrant C Data is divided into 100 sec bins |
 |
 |
| Module-wise count rates for Quadrant D Data is divided into 100 sec bins |
 |
 |
| Parameter | Plot |
|---|---|
| CZT HV Monitor |  |
| D_VDD |  |
| Temperature 1 |  |
| Veto HV Monitor | 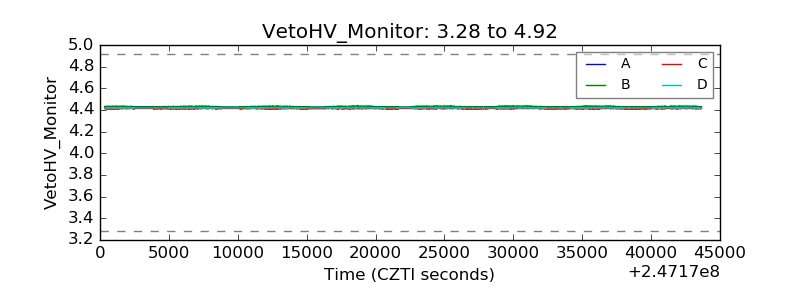 |
| Veto LLD |  |
| Alpha Counter |  |
| _CPM_Rate |  |
| CZT Counter |  |
| +2.5 Volts monitor |  |
| +5 Volts monitor |  |
| _ROLL_ROT |  |
| _Roll_DEC | 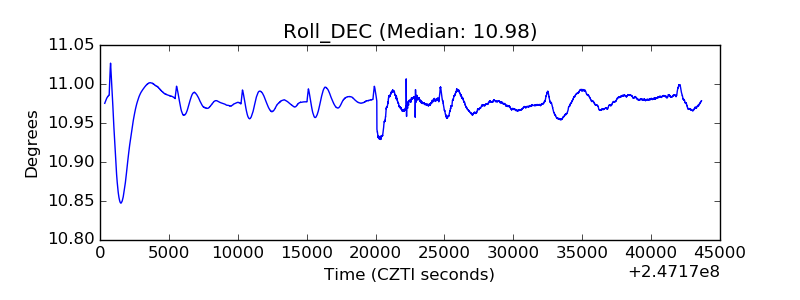 |
| _Roll_RA |  |
| Veto Counter |  |