| Param | Original file | Final file |
|---|---|---|
| Filename | modeM0/AS1A04_137T01_9000001654cztM0_level2.evt | modeM0/AS1A04_137T01_9000001654cztM0_level2_quad_clean.evt |
| Size (bytes) | 2,600,953,920 | 385,954,560 |
| Size | 2.4 GB | 368.1 MB |
| Events in quadrant A | 18,499,845 | 2,454,406 |
| Events in quadrant B | 21,395,811 | 2,383,053 |
| Events in quadrant C | 14,323,042 | 2,552,457 |
| Events in quadrant D | 22,650,530 | 2,357,216 |
| Mode SS | |||
|---|---|---|---|
| Quadrant | BADHDUFLAG | Total packets | Discarded packets |
| A | 0 | 576 | 0 |
| B | 0 | 576 | 0 |
| C | 0 | 576 | 0 |
| D | 0 | 576 | 0 |
| Mode M9 | |||
|---|---|---|---|
| Quadrant | BADHDUFLAG | Total packets | Discarded packets |
| A | 0 | 53 | 0 |
| B | 0 | 53 | 0 |
| C | 0 | 53 | 0 |
| D | 0 | 53 | 0 |
| Mode M0 | |||
|---|---|---|---|
| Quadrant | BADHDUFLAG | Total packets | Discarded packets |
| A | 0 | 73290 | 0 |
| B | 0 | 81996 | 0 |
| C | 0 | 61409 | 0 |
| D | 0 | 86245 | 0 |
| Quadrant | Total seconds | Saturated seconds | Saturation percentage |
|---|---|---|---|
| A | 28241 | 1186 | 4.199568% |
| B | 28241 | 2500 | 8.852378% |
| C | 28241 | 485 | 1.717361% |
| D | 28241 | 2574 | 9.114408% |
Noise dominated data is calculated using 1-second bins in cleaned event files. If a bin has >2000 counts, and if more than 50% of those come from <1% of pixels, then it is considered to be noise-dominated and hence unusable.
| Quadrant | # 1 sec bins | Bins with >0 counts | Bins with >2000 counts | High rate bins dominated by noise | Noise dominated (total time) | Noise dominated (detector-on time) | Marked lightcurve |
|---|---|---|---|---|---|---|---|
| A | 33341 | 28246 | 613 | 613 | 1.84% | 2.17% |  |
| B | 33341 | 28245 | 1464 | 1464 | 4.39% | 5.18% |  |
| C | 33341 | 28246 | 185 | 185 | 0.55% | 0.65% |  |
| D | 33341 | 28245 | 1792 | 1792 | 5.37% | 6.34% | 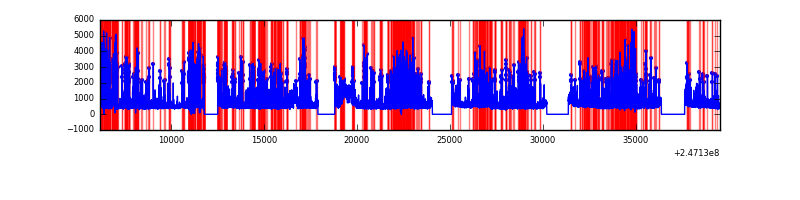 |
Top three noisy pixels from each quadrant. If the there are fewer than three noisy pixels in the level2.evt file, extra rows are filled as -1
| Pixel properties | Quadrant properties | ||||||
|---|---|---|---|---|---|---|---|
| Quadrant | DetID | PixID | Counts | Sigma | Mean | Median | Sigma |
| A | 8 | 5 | 3821968 | 5616.29 | 3375 | 3302 | 679.9 |
| A | 0 | 8 | 370307 | 539.77 | 3375 | 3302 | 679.9 |
| A | 1 | 162 | 270951 | 393.64 | 3375 | 3302 | 679.9 |
| B | 4 | 239 | 4113477 | 6607.72 | 3307 | 3226 | 622.0 |
| B | 3 | 64 | 3277259 | 5263.4 | 3307 | 3226 | 622.0 |
| B | 15 | 204 | 222498 | 352.51 | 3307 | 3226 | 622.0 |
| C | 9 | 204 | 1314254 | 1714.25 | 3330 | 3355 | 764.7 |
| C | 13 | 61 | 24428 | 27.56 | 3330 | 3355 | 764.7 |
| C | 14 | 234 | 17101 | 17.98 | 3330 | 3355 | 764.7 |
| D | 1 | 52 | 3983012 | 5198.46 | 3208 | 3122 | 765.6 |
| D | 10 | 253 | 2901710 | 3786.08 | 3208 | 3122 | 765.6 |
| D | 7 | 80 | 2108236 | 2749.66 | 3208 | 3122 | 765.6 |
Histogram calculated using DETX and DETY for each event in the final _common_clean file
| Quadrant A | 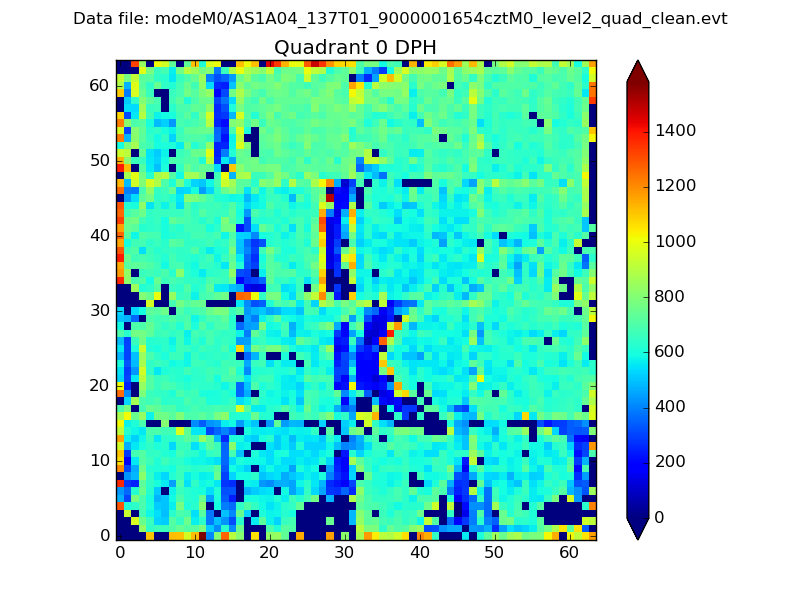 |
 |
Quadrant B |
|---|---|---|---|
| Quadrant D |  |
 |
Quadrant C |
| Plot type | Count rate plots | Images |
|---|---|---|
| Comparison with Poisson distribution Blue bars denote a histogram of data divided into 1 sec bins. Red curve is a Poisson curve with rate = median count rate of data. |
 |
 |
| Quadrant-wise count rates Data is divided into 100 sec bins |
 |
|
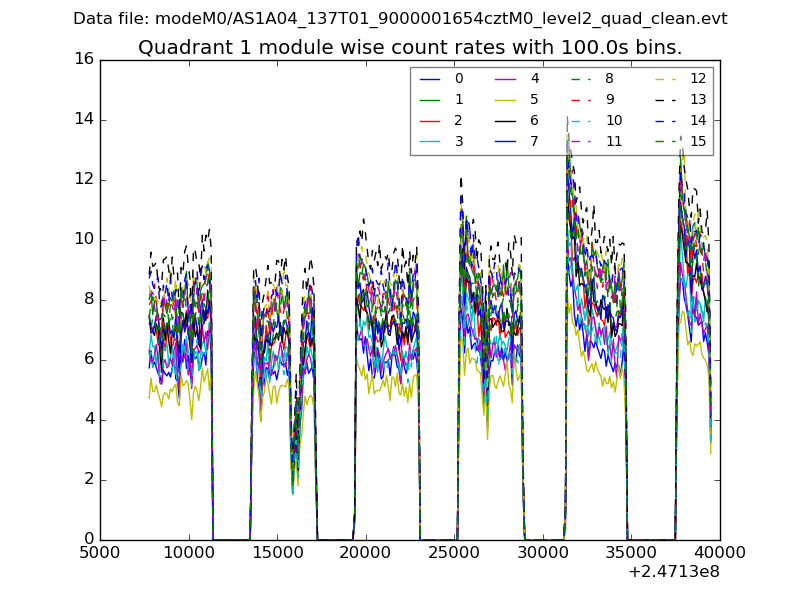
| Module-wise count rates for Quadrant A Data is divided into 100 sec bins |
 |
 |
| Module-wise count rates for Quadrant B Data is divided into 100 sec bins |
 |
 |
| Module-wise count rates for Quadrant C Data is divided into 100 sec bins |
 |
 |
| Module-wise count rates for Quadrant D Data is divided into 100 sec bins |
 |
 |
| Parameter | Plot |
|---|---|
| CZT HV Monitor |  |
| D_VDD |  |
| Temperature 1 |  |
| Veto HV Monitor |  |
| Veto LLD |  |
| Alpha Counter |  |
| _CPM_Rate |  |
| CZT Counter |  |
| +2.5 Volts monitor |  |
| +5 Volts monitor |  |
| _ROLL_ROT |  |
| _Roll_DEC |  |
| _Roll_RA |  |
| Veto Counter |  |