| Param | Original file | Final file |
|---|---|---|
| Filename | modeM0/AS1A04_144T01_9000001652cztM0_level2_bc.evt | modeM0/AS1A04_144T01_9000001652cztM0_level2_quad_clean.evt |
| Size (bytes) | 7,575,203,520 | 1,952,167,680 |
| Size | 7.1 GB | 1.8 GB |
| Events in quadrant A | 62,690,890 | 12,229,232 |
| Events in quadrant B | 49,446,243 | 12,784,930 |
| Events in quadrant C | 30,172,645 | 12,676,245 |
| Events in quadrant D | 76,837,238 | 11,087,558 |
| Mode M9 | |||
|---|---|---|---|
| Quadrant | BADHDUFLAG | Total packets | Discarded packets |
| A | 0 | 220 | 0 |
| B | 0 | 220 | 0 |
| C | 0 | 220 | 0 |
| D | 0 | 220 | 0 |
| Mode SS | |||
|---|---|---|---|
| Quadrant | BADHDUFLAG | Total packets | Discarded packets |
| A | 0 | 3072 | 0 |
| B | 0 | 3072 | 0 |
| C | 0 | 3072 | 0 |
| D | 0 | 3072 | 0 |
| Mode M0 | |||
|---|---|---|---|
| Quadrant | BADHDUFLAG | Total packets | Discarded packets |
| A | 0 | 440489 | 0 |
| B | 0 | 396105 | 0 |
| C | 0 | 312259 | 0 |
| D | 0 | 492528 | 0 |
| Quadrant | Total seconds | Saturated seconds | Saturation percentage |
|---|---|---|---|
| A | 150972 | 13013 | 8.619479% |
| B | 150972 | 10576 | 7.005273% |
| C | 150972 | 1466 | 0.971041% |
| D | 150972 | 17047 | 11.291498% |
Noise dominated data is calculated using 1-second bins in cleaned event files. If a bin has >2000 counts, and if more than 50% of those come from <1% of pixels, then it is considered to be noise-dominated and hence unusable.
| Quadrant | # 1 sec bins | Bins with >0 counts | Bins with >2000 counts | High rate bins dominated by noise | Noise dominated (total time) | Noise dominated (detector-on time) | Marked lightcurve |
|---|---|---|---|---|---|---|---|
| A | 173250 | 150971 | 2024 | 2024 | 1.17% | 1.34% |  |
| B | 173250 | 150976 | 83 | 83 | 0.05% | 0.05% | 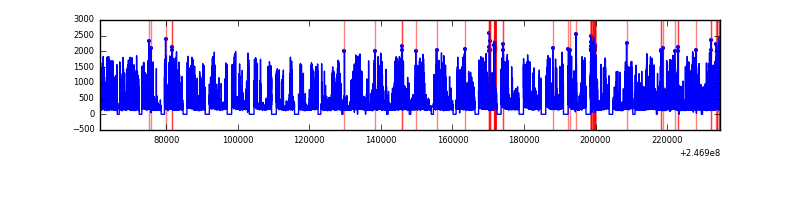 |
| C | 173250 | 150976 | 145 | 145 | 0.08% | 0.10% |  |
| D | 173250 | 150940 | 3142 | 3142 | 1.81% | 2.08% | 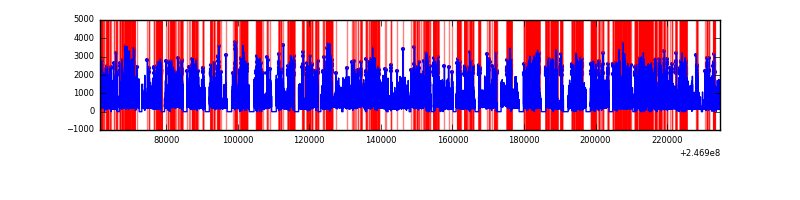 |
Top three noisy pixels from each quadrant. If the there are fewer than three noisy pixels in the level2.evt file, extra rows are filled as -1
| Pixel properties | Quadrant properties | ||||||
|---|---|---|---|---|---|---|---|
| Quadrant | DetID | PixID | Counts | Sigma | Mean | Median | Sigma |
| A | 8 | 5 | 29132348 | 17474.2 | 7359 | 7150 | 1666.8 |
| A | 0 | 8 | 2927454 | 1752.09 | 7359 | 7150 | 1666.8 |
| A | 8 | 15 | 708189 | 420.6 | 7359 | 7150 | 1666.8 |
| B | 4 | 239 | 15380905 | 10008.19 | 7627 | 7352 | 1536.1 |
| B | 3 | 64 | 1644138 | 1065.55 | 7627 | 7352 | 1536.1 |
| B | 4 | 81 | 837821 | 540.64 | 7627 | 7352 | 1536.1 |
| C | 9 | 204 | 510989 | 302.23 | 7519 | 7390 | 1666.3 |
| C | 14 | 234 | 174493 | 100.28 | 7519 | 7390 | 1666.3 |
| C | 13 | 61 | 44837 | 22.47 | 7519 | 7390 | 1666.3 |
| D | 10 | 253 | 13474227 | 8267.9 | 7022 | 6757 | 1628.9 |
| D | 1 | 52 | 11298196 | 6932.0 | 7022 | 6757 | 1628.9 |
| D | 8 | 195 | 5907106 | 3622.32 | 7022 | 6757 | 1628.9 |
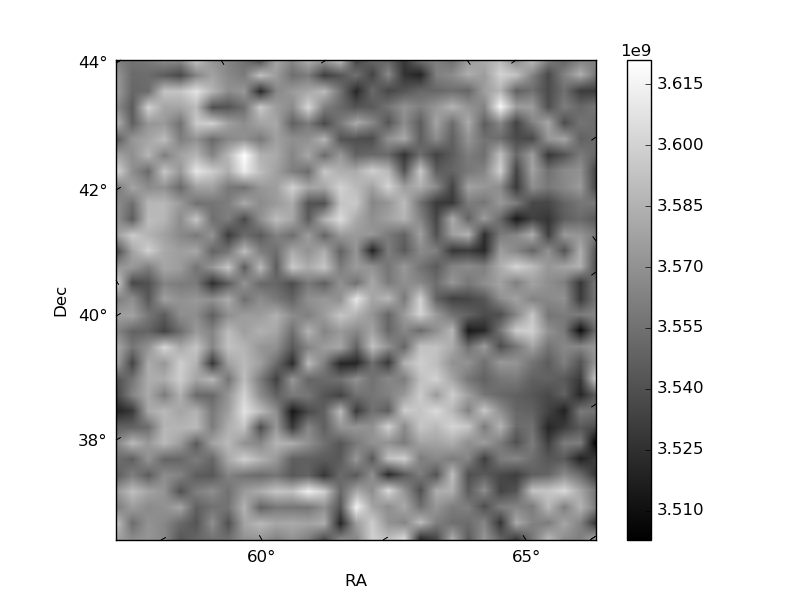
Histogram calculated using DETX and DETY for each event in the final _common_clean file
| Quadrant A | 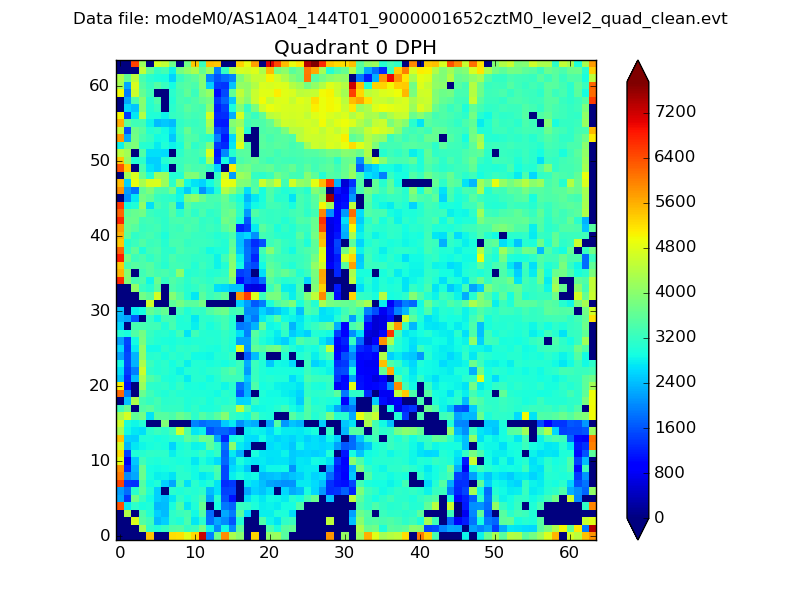 |
 |
Quadrant B |
|---|---|---|---|
| Quadrant D |  |
 |
Quadrant C |
| Plot type | Count rate plots | Images |
|---|---|---|
| Comparison with Poisson distribution Blue bars denote a histogram of data divided into 1 sec bins. Red curve is a Poisson curve with rate = median count rate of data. |
 |
 |
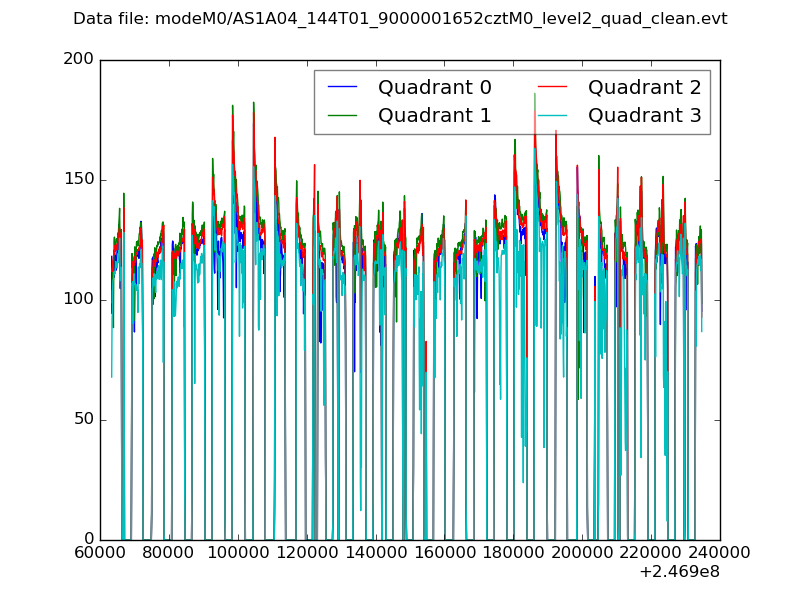
| Quadrant-wise count rates Data is divided into 100 sec bins |
 |
|
| Module-wise count rates for Quadrant A Data is divided into 100 sec bins |
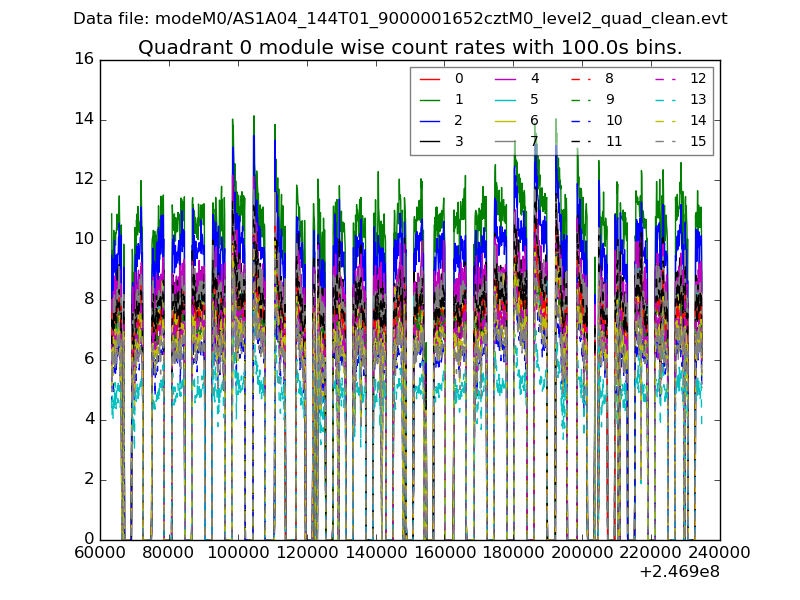 |
 |
| Module-wise count rates for Quadrant B Data is divided into 100 sec bins |
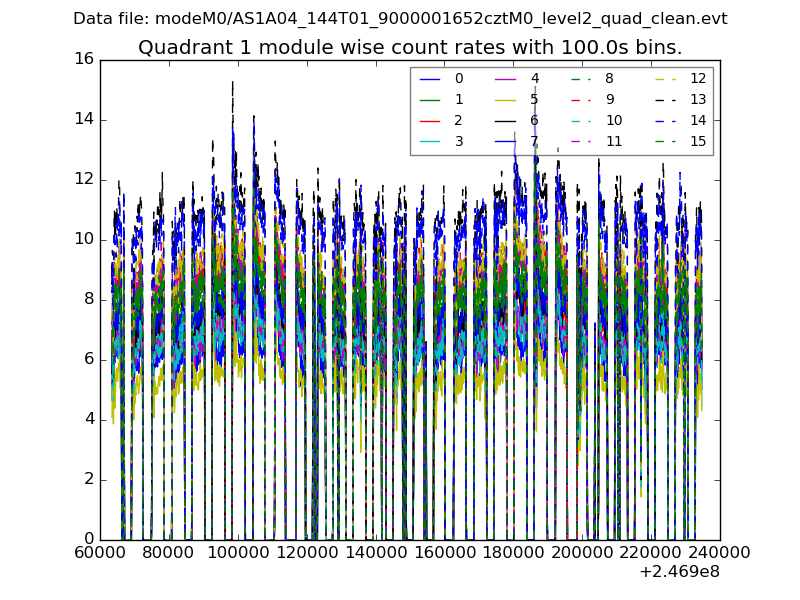 |
 |
| Module-wise count rates for Quadrant C Data is divided into 100 sec bins |
 |
 |
| Module-wise count rates for Quadrant D Data is divided into 100 sec bins |
 |
 |
| Parameter | Plot |
|---|---|
| CZT HV Monitor |  |
| D_VDD | 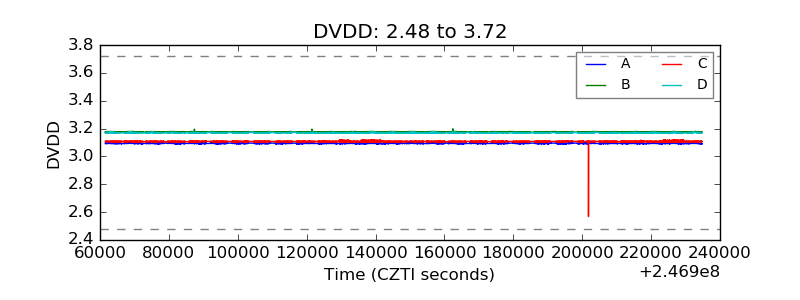 |
| Temperature 1 |  |
| Veto HV Monitor |  |
| Veto LLD |  |
| Alpha Counter |  |
| _CPM_Rate |  |
| CZT Counter |  |
| +2.5 Volts monitor |  |
| +5 Volts monitor |  |
| _ROLL_ROT |  |
| _Roll_DEC |  |
| _Roll_RA |  |
| Veto Counter | 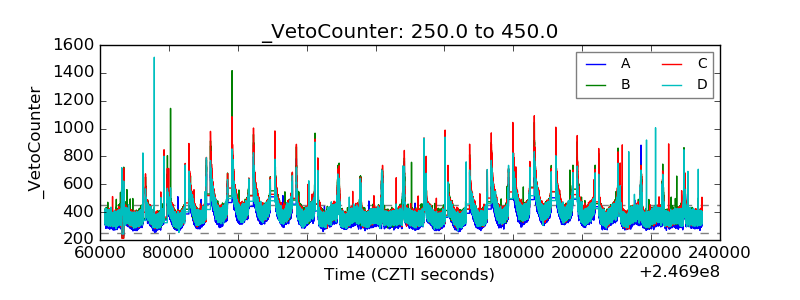 |