| Param | Original file | Final file |
|---|---|---|
| Filename | modeM0/AS1A04_044T01_9000001648cztM0_level2.evt | modeM0/AS1A04_044T01_9000001648cztM0_level2_quad_clean.evt |
| Size (bytes) | 6,570,763,200 | 838,232,640 |
| Size | 6.1 GB | 799.4 MB |
| Events in quadrant A | 51,655,944 | 5,240,289 |
| Events in quadrant B | 47,600,357 | 5,519,563 |
| Events in quadrant C | 30,785,350 | 5,335,455 |
| Events in quadrant D | 64,445,964 | 4,686,599 |
| Mode SS | |||
|---|---|---|---|
| Quadrant | BADHDUFLAG | Total packets | Discarded packets |
| A | 0 | 1272 | 0 |
| B | 0 | 1272 | 0 |
| C | 0 | 1272 | 0 |
| D | 0 | 1272 | 0 |
| Mode M9 | |||
|---|---|---|---|
| Quadrant | BADHDUFLAG | Total packets | Discarded packets |
| A | 0 | 107 | 0 |
| B | 0 | 107 | 0 |
| C | 0 | 107 | 0 |
| D | 0 | 107 | 0 |
| Mode M0 | |||
|---|---|---|---|
| Quadrant | BADHDUFLAG | Total packets | Discarded packets |
| A | 0 | 198447 | 0 |
| B | 0 | 186402 | 0 |
| C | 0 | 138271 | 0 |
| D | 0 | 237457 | 0 |
| Quadrant | Total seconds | Saturated seconds | Saturation percentage |
|---|---|---|---|
| A | 67448 | 5035 | 7.465010% |
| B | 67448 | 5131 | 7.607342% |
| C | 67448 | 444 | 0.658285% |
| D | 67448 | 8853 | 13.125667% |
Noise dominated data is calculated using 1-second bins in cleaned event files. If a bin has >2000 counts, and if more than 50% of those come from <1% of pixels, then it is considered to be noise-dominated and hence unusable.
| Quadrant | # 1 sec bins | Bins with >0 counts | Bins with >2000 counts | High rate bins dominated by noise | Noise dominated (total time) | Noise dominated (detector-on time) | Marked lightcurve |
|---|---|---|---|---|---|---|---|
| A | 78368 | 67459 | 2956 | 2956 | 3.77% | 4.38% |  |
| B | 78368 | 67458 | 2448 | 2448 | 3.12% | 3.63% | 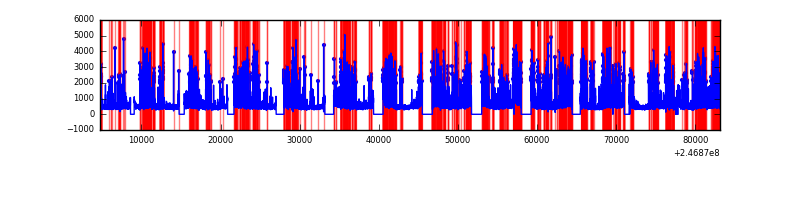 |
| C | 78368 | 67460 | 0 | 0 | 0.00% | 0.00% | 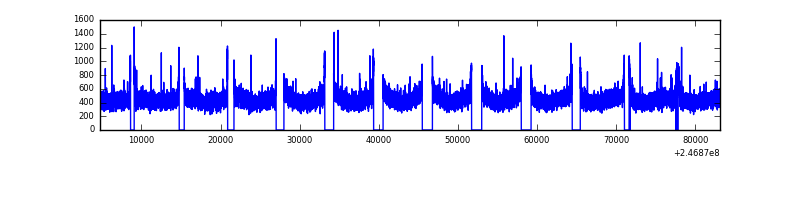 |
| D | 78368 | 67455 | 7005 | 7005 | 8.94% | 10.38% |  |
Top three noisy pixels from each quadrant. If the there are fewer than three noisy pixels in the level2.evt file, extra rows are filled as -1
| Pixel properties | Quadrant properties | ||||||
|---|---|---|---|---|---|---|---|
| Quadrant | DetID | PixID | Counts | Sigma | Mean | Median | Sigma |
| A | 8 | 5 | 9142197 | 5774.66 | 7864 | 7707 | 1581.8 |
| A | 14 | 238 | 6399026 | 4040.47 | 7864 | 7707 | 1581.8 |
| A | 13 | 251 | 2322332 | 1463.26 | 7864 | 7707 | 1581.8 |
| B | 4 | 239 | 8926492 | 5909.47 | 7968 | 7778 | 1509.2 |
| B | 3 | 64 | 5280597 | 3493.73 | 7968 | 7778 | 1509.2 |
| B | 11 | 51 | 801516 | 525.92 | 7968 | 7778 | 1509.2 |
| C | 13 | 61 | 57958 | 27.29 | 7889 | 7927 | 1833.6 |
| C | 9 | 204 | 24646 | 9.12 | 7889 | 7927 | 1833.6 |
| C | 14 | 234 | 22597 | 8.0 | 7889 | 7927 | 1833.6 |
| D | 10 | 253 | 8462889 | 4785.93 | 7332 | 7127 | 1766.8 |
| D | 1 | 52 | 5918048 | 3345.56 | 7332 | 7127 | 1766.8 |
| D | 13 | 152 | 5455925 | 3084.0 | 7332 | 7127 | 1766.8 |
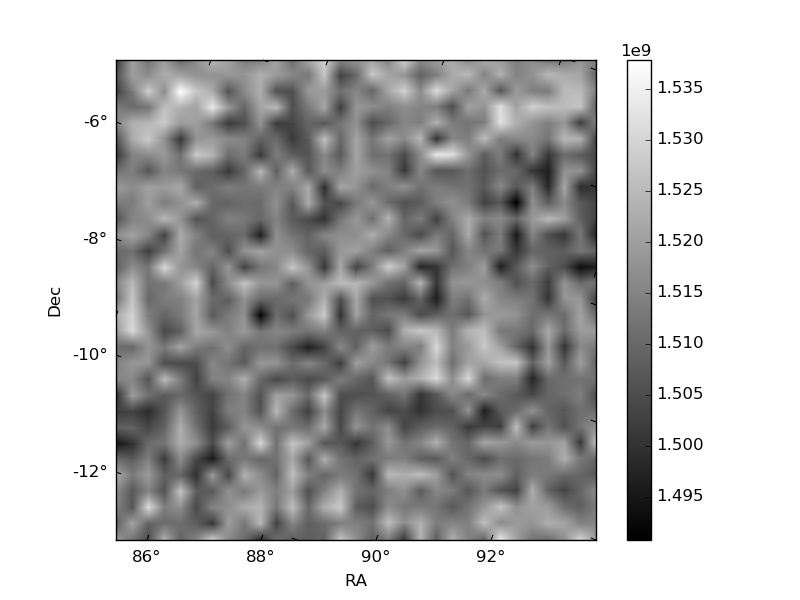
Histogram calculated using DETX and DETY for each event in the final _common_clean file
| Quadrant A |  |
 |
Quadrant B |
|---|---|---|---|
| Quadrant D |  |
 |
Quadrant C |
| Plot type | Count rate plots | Images |
|---|---|---|
| Comparison with Poisson distribution Blue bars denote a histogram of data divided into 1 sec bins. Red curve is a Poisson curve with rate = median count rate of data. |
 |
 |
| Quadrant-wise count rates Data is divided into 100 sec bins |
 |
|
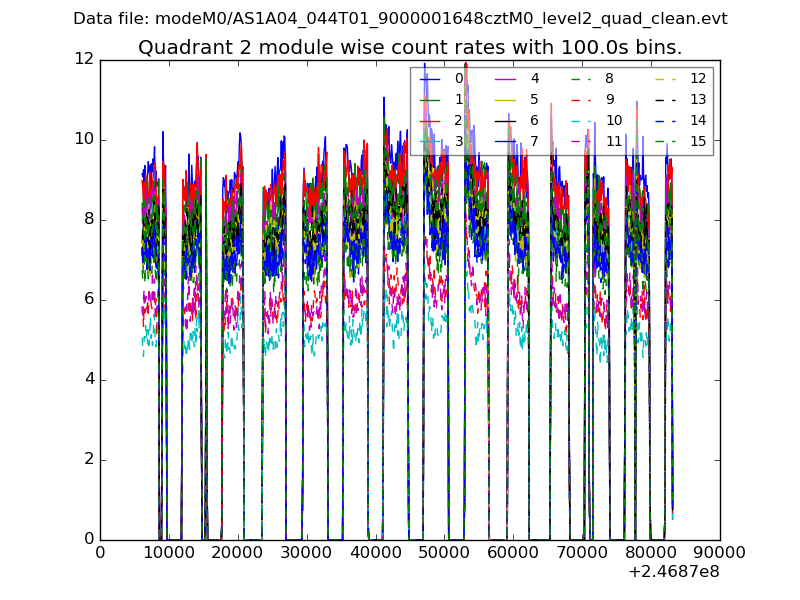
| Module-wise count rates for Quadrant A Data is divided into 100 sec bins |
 |
 |
| Module-wise count rates for Quadrant B Data is divided into 100 sec bins |
 |
 |
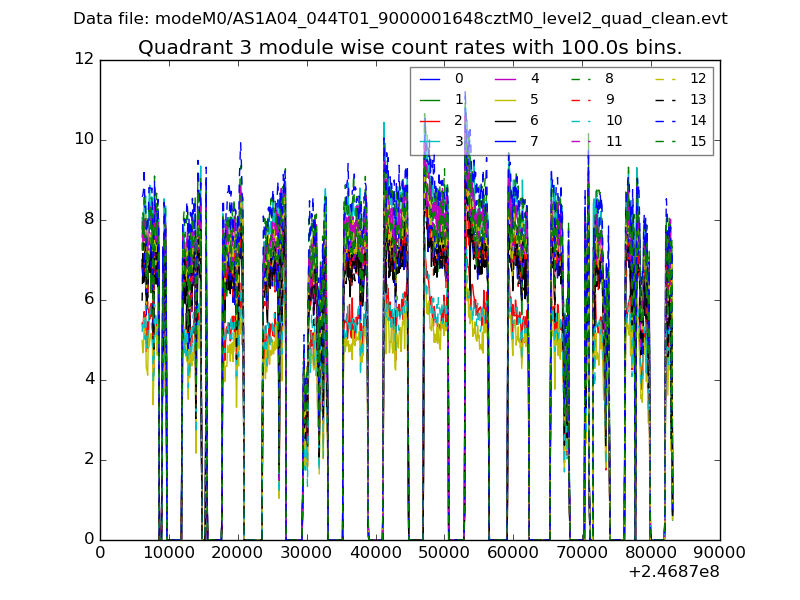
| Module-wise count rates for Quadrant C Data is divided into 100 sec bins |
 |
 |
| Module-wise count rates for Quadrant D Data is divided into 100 sec bins |
 |
 |
| Parameter | Plot |
|---|---|
| CZT HV Monitor | 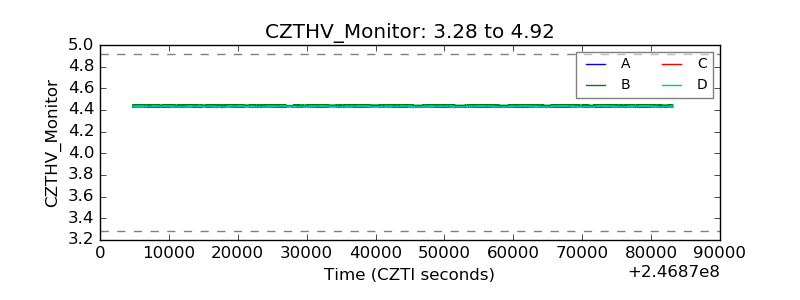 |
| D_VDD | 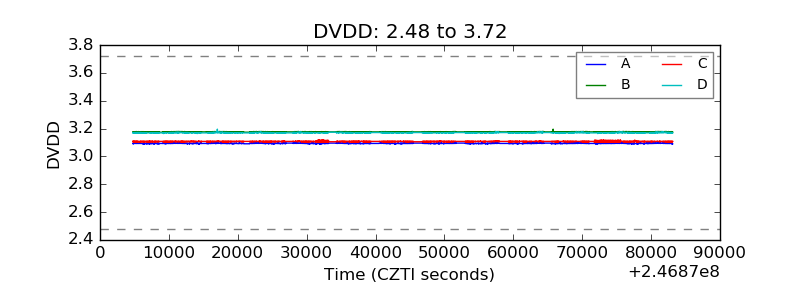 |
| Temperature 1 | 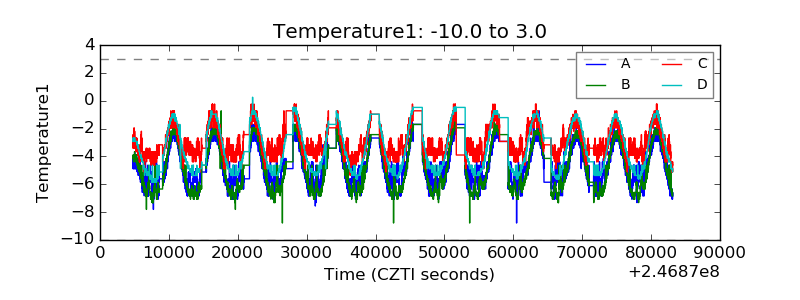 |
| Veto HV Monitor |  |
| Veto LLD |  |
| Alpha Counter |  |
| _CPM_Rate | 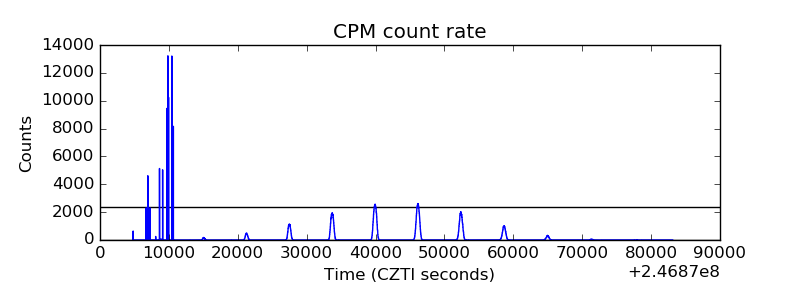 |
| CZT Counter |  |
| +2.5 Volts monitor | 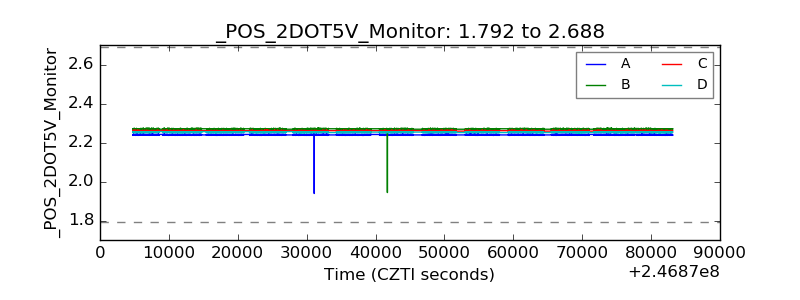 |
| +5 Volts monitor |  |
| _ROLL_ROT | 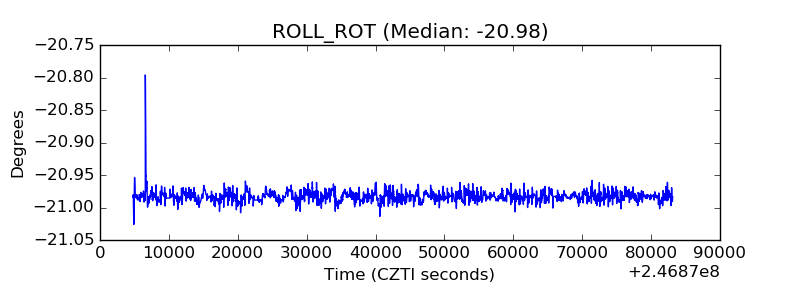 |
| _Roll_DEC |  |
| _Roll_RA |  |
| Veto Counter |  |