| Param | Original file | Final file |
|---|---|---|
| Filename | modeM0/AS1C03_012T01_9000001642cztM0_level2.evt | modeM0/AS1C03_012T01_9000001642cztM0_level2_quad_clean.evt |
| Size (bytes) | 3,104,199,360 | 488,664,000 |
| Size | 2.9 GB | 466.0 MB |
| Events in quadrant A | 22,426,852 | 3,207,840 |
| Events in quadrant B | 20,651,041 | 3,298,464 |
| Events in quadrant C | 15,663,808 | 3,233,467 |
| Events in quadrant D | 33,078,644 | 2,822,202 |
| Mode M0 | |||
|---|---|---|---|
| Quadrant | BADHDUFLAG | Total packets | Discarded packets |
| A | 0 | 87866 | 0 |
| B | 0 | 82435 | 0 |
| C | 0 | 67965 | 0 |
| D | 0 | 120782 | 0 |
| Mode SS | |||
|---|---|---|---|
| Quadrant | BADHDUFLAG | Total packets | Discarded packets |
| A | 0 | 664 | 0 |
| B | 0 | 664 | 0 |
| C | 0 | 664 | 0 |
| D | 0 | 664 | 0 |
| Mode M9 | |||
|---|---|---|---|
| Quadrant | BADHDUFLAG | Total packets | Discarded packets |
| A | 0 | 78 | 0 |
| B | 0 | 78 | 0 |
| C | 0 | 78 | 0 |
| D | 0 | 78 | 0 |
| Quadrant | Total seconds | Saturated seconds | Saturation percentage |
|---|---|---|---|
| A | 32581 | 1526 | 4.683711% |
| B | 32581 | 1349 | 4.140450% |
| C | 32581 | 195 | 0.598508% |
| D | 32581 | 5213 | 16.000123% |
Noise dominated data is calculated using 1-second bins in cleaned event files. If a bin has >2000 counts, and if more than 50% of those come from <1% of pixels, then it is considered to be noise-dominated and hence unusable.
| Quadrant | # 1 sec bins | Bins with >0 counts | Bins with >2000 counts | High rate bins dominated by noise | Noise dominated (total time) | Noise dominated (detector-on time) | Marked lightcurve |
|---|---|---|---|---|---|---|---|
| A | 40316 | 32587 | 910 | 910 | 2.26% | 2.79% |  |
| B | 40316 | 32588 | 580 | 580 | 1.44% | 1.78% |  |
| C | 40316 | 32588 | 39 | 39 | 0.10% | 0.12% |  |
| D | 40316 | 32588 | 4186 | 4186 | 10.38% | 12.85% |  |
Top three noisy pixels from each quadrant. If the there are fewer than three noisy pixels in the level2.evt file, extra rows are filled as -1
| Pixel properties | Quadrant properties | ||||||
|---|---|---|---|---|---|---|---|
| Quadrant | DetID | PixID | Counts | Sigma | Mean | Median | Sigma |
| A | 14 | 238 | 3186836 | 3983.4 | 3992 | 3934 | 799.0 |
| A | 8 | 5 | 2070126 | 2585.84 | 3992 | 3934 | 799.0 |
| A | 8 | 15 | 543471 | 675.23 | 3992 | 3934 | 799.0 |
| B | 4 | 239 | 3794610 | 5078.28 | 4034 | 3951 | 746.4 |
| B | 11 | 51 | 504820 | 671.01 | 4034 | 3951 | 746.4 |
| B | 15 | 204 | 200716 | 263.6 | 4034 | 3951 | 746.4 |
| C | 9 | 204 | 187677 | 203.08 | 3949 | 3990 | 904.5 |
| C | 5 | 239 | 70158 | 73.15 | 3949 | 3990 | 904.5 |
| C | 13 | 61 | 28843 | 27.48 | 3949 | 3990 | 904.5 |
| D | 13 | 152 | 6145486 | 7143.07 | 3649 | 3564 | 859.8 |
| D | 13 | 104 | 4181917 | 4859.43 | 3649 | 3564 | 859.8 |
| D | 8 | 195 | 2544917 | 2955.6 | 3649 | 3564 | 859.8 |
Histogram calculated using DETX and DETY for each event in the final _common_clean file
| Quadrant A | 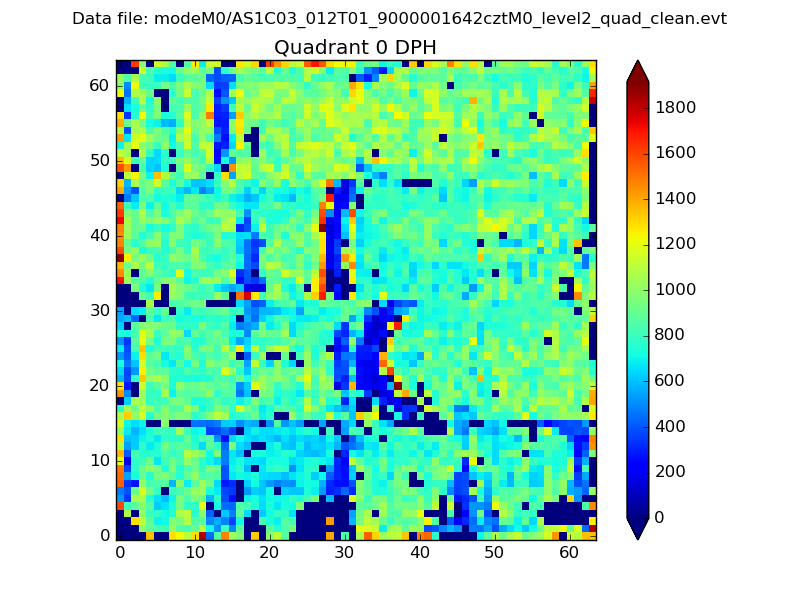 |
 |
Quadrant B |
|---|---|---|---|
| Quadrant D |  |
 |
Quadrant C |
| Plot type | Count rate plots | Images |
|---|---|---|
| Comparison with Poisson distribution Blue bars denote a histogram of data divided into 1 sec bins. Red curve is a Poisson curve with rate = median count rate of data. |
 |
 |
| Quadrant-wise count rates Data is divided into 100 sec bins |
 |
|
| Module-wise count rates for Quadrant A Data is divided into 100 sec bins |
 |
 |
| Module-wise count rates for Quadrant B Data is divided into 100 sec bins |
 |
 |
| Module-wise count rates for Quadrant C Data is divided into 100 sec bins |
 |
 |
| Module-wise count rates for Quadrant D Data is divided into 100 sec bins |
 |
 |
| Parameter | Plot |
|---|---|
| CZT HV Monitor |  |
| D_VDD |  |
| Temperature 1 |  |
| Veto HV Monitor |  |
| Veto LLD |  |
| Alpha Counter | 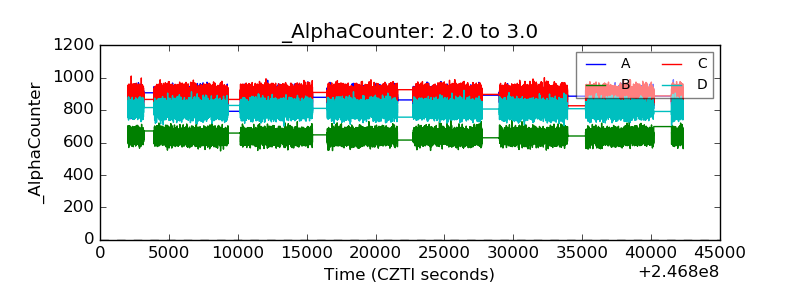 |
| _CPM_Rate |  |
| CZT Counter |  |
| +2.5 Volts monitor |  |
| +5 Volts monitor |  |
| _ROLL_ROT |  |
| _Roll_DEC |  |
| _Roll_RA |  |
| Veto Counter |  |