| Param | Original file | Final file |
|---|---|---|
| Filename | modeM0/AS1A04_080T01_9000001644cztM0_level2.evt | modeM0/AS1A04_080T01_9000001644cztM0_level2_quad_clean.evt |
| Size (bytes) | 1,909,013,760 | 203,558,400 |
| Size | 1.8 GB | 194.1 MB |
| Events in quadrant A | 11,350,799 | 1,254,160 |
| Events in quadrant B | 12,848,987 | 1,237,240 |
| Events in quadrant C | 8,424,402 | 1,275,967 |
| Events in quadrant D | 23,934,314 | 1,107,345 |
| Mode M9 | |||
|---|---|---|---|
| Quadrant | BADHDUFLAG | Total packets | Discarded packets |
| A | 0 | 26 | 0 |
| B | 0 | 26 | 0 |
| C | 0 | 26 | 0 |
| D | 0 | 26 | 0 |
| Mode M0 | |||
|---|---|---|---|
| Quadrant | BADHDUFLAG | Total packets | Discarded packets |
| A | 0 | 45473 | 0 |
| B | 0 | 50575 | 0 |
| C | 0 | 38188 | 0 |
| D | 0 | 84287 | 0 |
| Mode SS | |||
|---|---|---|---|
| Quadrant | BADHDUFLAG | Total packets | Discarded packets |
| A | 0 | 380 | 0 |
| B | 0 | 380 | 0 |
| C | 0 | 380 | 0 |
| D | 0 | 380 | 0 |
| Quadrant | Total seconds | Saturated seconds | Saturation percentage |
|---|---|---|---|
| A | 18710 | 511 | 2.731160% |
| B | 18710 | 1284 | 6.862640% |
| C | 18710 | 89 | 0.475681% |
| D | 18710 | 1455 | 7.776590% |
Noise dominated data is calculated using 1-second bins in cleaned event files. If a bin has >2000 counts, and if more than 50% of those come from <1% of pixels, then it is considered to be noise-dominated and hence unusable.
| Quadrant | # 1 sec bins | Bins with >0 counts | Bins with >2000 counts | High rate bins dominated by noise | Noise dominated (total time) | Noise dominated (detector-on time) | Marked lightcurve |
|---|---|---|---|---|---|---|---|
| A | 21295 | 18713 | 287 | 287 | 1.35% | 1.53% |  |
| B | 21295 | 18713 | 693 | 693 | 3.25% | 3.70% | 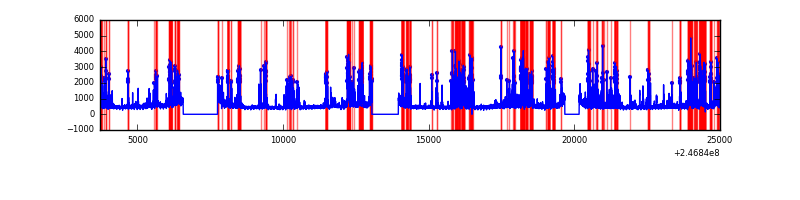 |
| C | 21295 | 18713 | 5 | 5 | 0.02% | 0.03% |  |
| D | 21295 | 18713 | 961 | 961 | 4.51% | 5.14% |  |
Top three noisy pixels from each quadrant. If the there are fewer than three noisy pixels in the level2.evt file, extra rows are filled as -1
| Pixel properties | Quadrant properties | ||||||
|---|---|---|---|---|---|---|---|
| Quadrant | DetID | PixID | Counts | Sigma | Mean | Median | Sigma |
| A | 14 | 238 | 1285073 | 2894.26 | 2181 | 2135 | 443.3 |
| A | 13 | 251 | 694570 | 1562.11 | 2181 | 2135 | 443.3 |
| A | 8 | 5 | 353791 | 793.32 | 2181 | 2135 | 443.3 |
| B | 4 | 239 | 2947665 | 7101.51 | 2169 | 2113 | 414.8 |
| B | 3 | 64 | 913024 | 2196.14 | 2169 | 2113 | 414.8 |
| B | 11 | 51 | 162934 | 387.73 | 2169 | 2113 | 414.8 |
| C | 9 | 204 | 32776 | 61.25 | 2150 | 2160 | 499.8 |
| C | 13 | 61 | 15725 | 27.14 | 2150 | 2160 | 499.8 |
| C | 5 | 239 | 10945 | 17.58 | 2150 | 2160 | 499.8 |
| D | 1 | 52 | 12605100 | 25555.34 | 2056 | 1999 | 493.2 |
| D | 10 | 253 | 910991 | 1843.17 | 2056 | 1999 | 493.2 |
| D | 13 | 152 | 863051 | 1745.96 | 2056 | 1999 | 493.2 |
Histogram calculated using DETX and DETY for each event in the final _common_clean file
| Quadrant A | 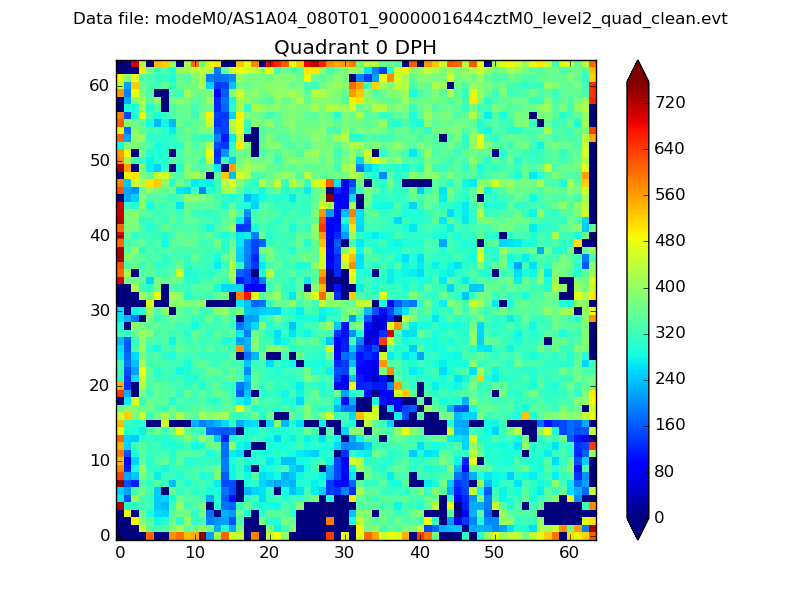 |
 |
Quadrant B |
|---|---|---|---|
| Quadrant D |  |
 |
Quadrant C |
| Plot type | Count rate plots | Images |
|---|---|---|
| Comparison with Poisson distribution Blue bars denote a histogram of data divided into 1 sec bins. Red curve is a Poisson curve with rate = median count rate of data. |
 |
 |
| Quadrant-wise count rates Data is divided into 100 sec bins |
 |
|
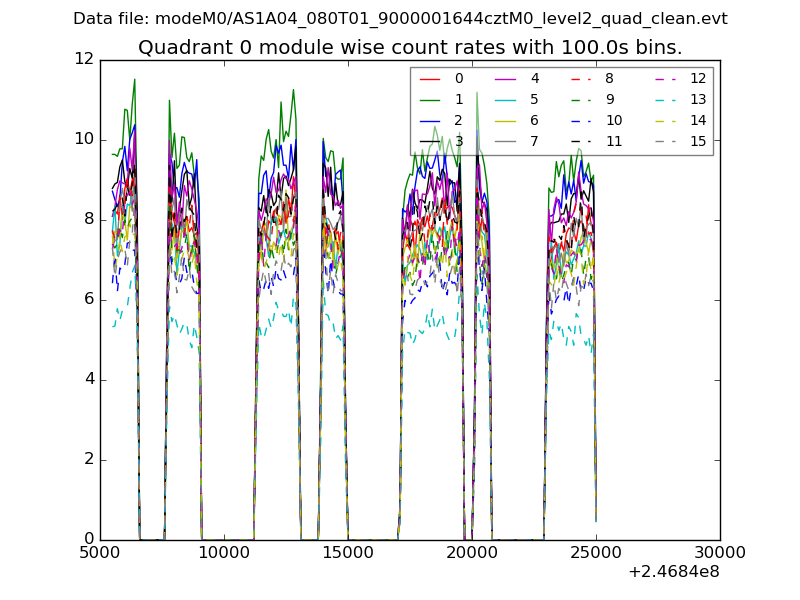
| Module-wise count rates for Quadrant A Data is divided into 100 sec bins |
 |
 |
| Module-wise count rates for Quadrant B Data is divided into 100 sec bins |
 |
 |
| Module-wise count rates for Quadrant C Data is divided into 100 sec bins |
 |
 |
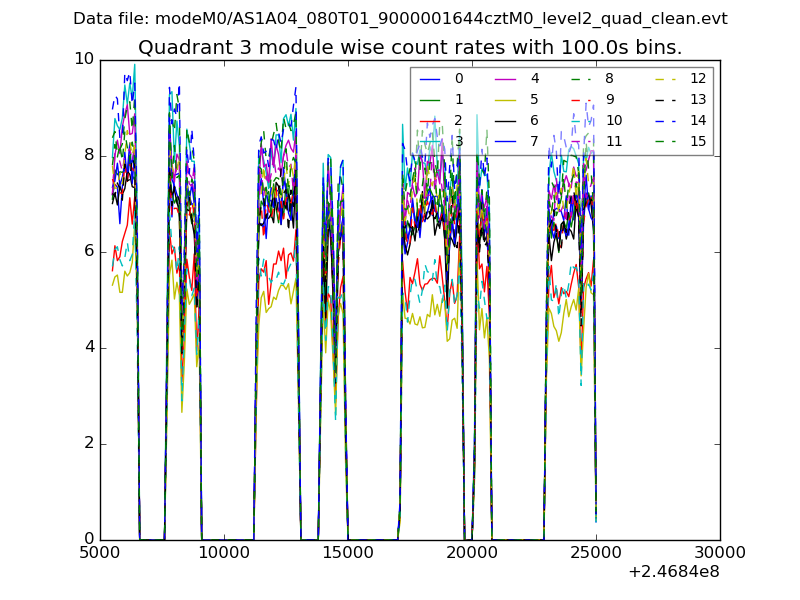
| Module-wise count rates for Quadrant D Data is divided into 100 sec bins |
 |
 |
| Parameter | Plot |
|---|---|
| CZT HV Monitor |  |
| D_VDD | 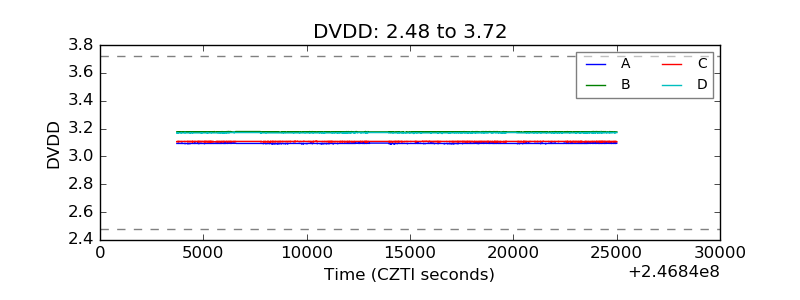 |
| Temperature 1 | 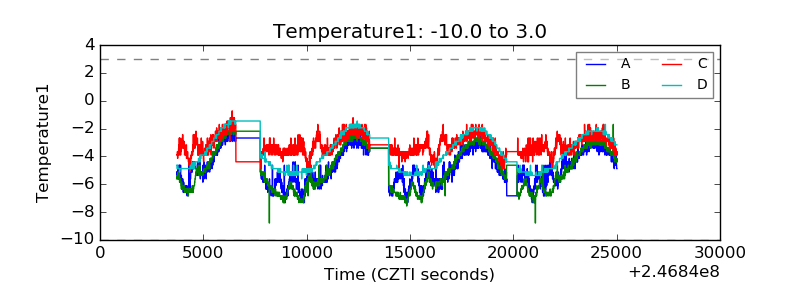 |
| Veto HV Monitor |  |
| Veto LLD |  |
| Alpha Counter | 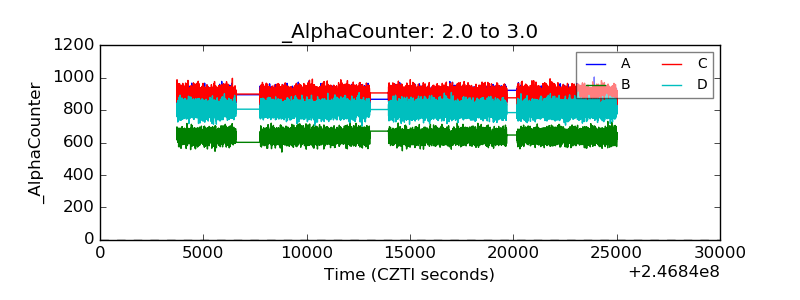 |
| _CPM_Rate |  |
| CZT Counter | 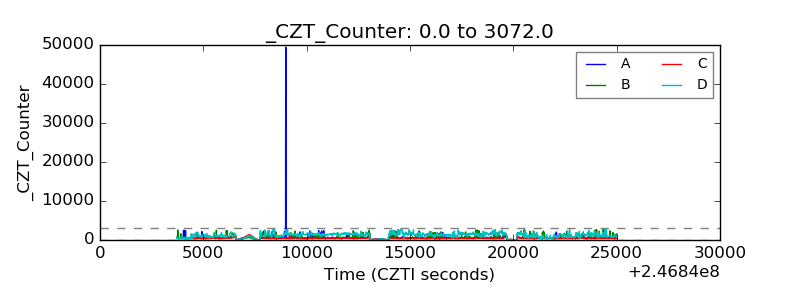 |
| +2.5 Volts monitor |  |
| +5 Volts monitor |  |
| _ROLL_ROT |  |
| _Roll_DEC |  |
| _Roll_RA | 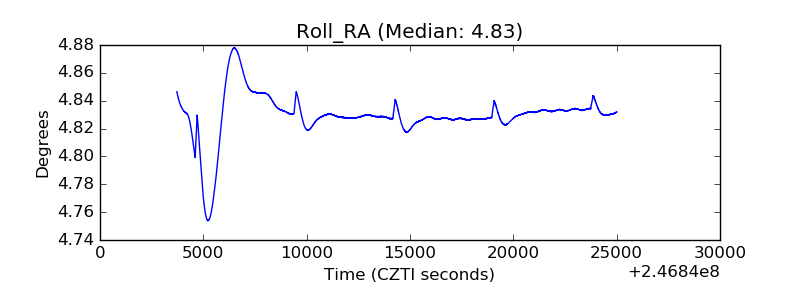 |
| Veto Counter | 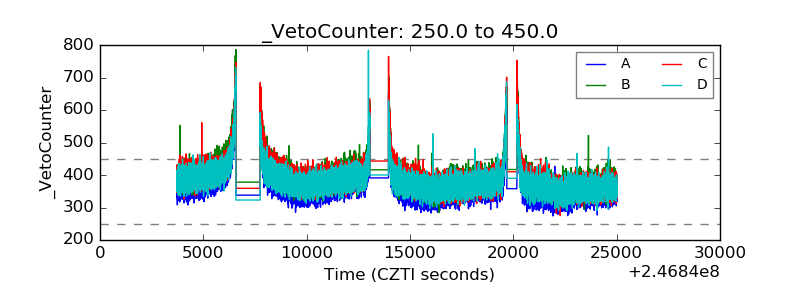 |