| Param | Original file | Final file |
|---|---|---|
| Filename | modeM0/AS1T01_202T01_9000001640cztM0_level2.evt | modeM0/AS1T01_202T01_9000001640cztM0_level2_quad_clean.evt |
| Size (bytes) | 5,785,050,240 | 1,173,490,560 |
| Size | 5.4 GB | 1.1 GB |
| Events in quadrant A | 42,706,052 | 7,888,537 |
| Events in quadrant B | 40,774,969 | 7,964,348 |
| Events in quadrant C | 41,627,722 | 7,770,714 |
| Events in quadrant D | 45,665,816 | 7,409,124 |
| Mode M0 | |||
|---|---|---|---|
| Quadrant | BADHDUFLAG | Total packets | Discarded packets |
| A | 0 | 169530 | 0 |
| B | 0 | 163369 | 0 |
| C | 0 | 166892 | 0 |
| D | 0 | 179075 | 0 |
| Mode M9 | |||
|---|---|---|---|
| Quadrant | BADHDUFLAG | Total packets | Discarded packets |
| A | 0 | 96 | 0 |
| B | 0 | 96 | 0 |
| C | 0 | 96 | 0 |
| D | 0 | 96 | 0 |
| Mode SS | |||
|---|---|---|---|
| Quadrant | BADHDUFLAG | Total packets | Discarded packets |
| A | 0 | 1342 | 0 |
| B | 0 | 1342 | 0 |
| C | 0 | 1344 | 0 |
| D | 0 | 1344 | 0 |
| Quadrant | Total seconds | Saturated seconds | Saturation percentage |
|---|---|---|---|
| A | 65777 | 2869 | 4.361707% |
| B | 65775 | 2838 | 4.314709% |
| C | 65777 | 5212 | 7.923742% |
| D | 65774 | 3134 | 4.764801% |
Noise dominated data is calculated using 1-second bins in cleaned event files. If a bin has >2000 counts, and if more than 50% of those come from <1% of pixels, then it is considered to be noise-dominated and hence unusable.
| Quadrant | # 1 sec bins | Bins with >0 counts | Bins with >2000 counts | High rate bins dominated by noise | Noise dominated (total time) | Noise dominated (detector-on time) | Marked lightcurve |
|---|---|---|---|---|---|---|---|
| A | 75688 | 65794 | 1363 | 1363 | 1.80% | 2.07% |  |
| B | 75688 | 65793 | 1025 | 1025 | 1.35% | 1.56% |  |
| C | 75688 | 65798 | 2939 | 2939 | 3.88% | 4.47% |  |
| D | 75688 | 65794 | 1967 | 1967 | 2.60% | 2.99% |  |
Top three noisy pixels from each quadrant. If the there are fewer than three noisy pixels in the level2.evt file, extra rows are filled as -1
| Pixel properties | Quadrant properties | ||||||
|---|---|---|---|---|---|---|---|
| Quadrant | DetID | PixID | Counts | Sigma | Mean | Median | Sigma |
| A | 8 | 5 | 5533281 | 3077.34 | 8157 | 7993 | 1795.5 |
| A | 14 | 238 | 3191338 | 1772.98 | 8157 | 7993 | 1795.5 |
| A | 15 | 174 | 1064989 | 588.7 | 8157 | 7993 | 1795.5 |
| B | 4 | 239 | 6129540 | 3789.62 | 8220 | 8066 | 1615.3 |
| B | 11 | 51 | 900996 | 552.79 | 8220 | 8066 | 1615.3 |
| B | 15 | 204 | 476505 | 290.0 | 8220 | 8066 | 1615.3 |
| C | 4 | 254 | 11058455 | 5994.85 | 7805 | 7921 | 1843.3 |
| C | 9 | 204 | 77785 | 37.9 | 7805 | 7921 | 1843.3 |
| C | 13 | 61 | 57257 | 26.76 | 7805 | 7921 | 1843.3 |
| D | 8 | 195 | 3432317 | 1699.78 | 7860 | 7660 | 2014.8 |
| D | 13 | 104 | 2559961 | 1266.8 | 7860 | 7660 | 2014.8 |
| D | 10 | 253 | 2402347 | 1188.57 | 7860 | 7660 | 2014.8 |
Histogram calculated using DETX and DETY for each event in the final _common_clean file
| Quadrant A |  |
 |
Quadrant B |
|---|---|---|---|
| Quadrant D |  |
 |
Quadrant C |
| Plot type | Count rate plots | Images |
|---|---|---|
| Comparison with Poisson distribution Blue bars denote a histogram of data divided into 1 sec bins. Red curve is a Poisson curve with rate = median count rate of data. |
 |
 |
| Quadrant-wise count rates Data is divided into 100 sec bins |
 |
|
| Module-wise count rates for Quadrant A Data is divided into 100 sec bins |
 |
 |
| Module-wise count rates for Quadrant B Data is divided into 100 sec bins |
 |
 |
| Module-wise count rates for Quadrant C Data is divided into 100 sec bins |
 |
 |
| Module-wise count rates for Quadrant D Data is divided into 100 sec bins |
 |
 |
| Parameter | Plot |
|---|---|
| CZT HV Monitor |  |
| D_VDD |  |
| Temperature 1 |  |
| Veto HV Monitor |  |
| Veto LLD |  |
| Alpha Counter |  |
| _CPM_Rate |  |
| CZT Counter |  |
| +2.5 Volts monitor |  |
| +5 Volts monitor | 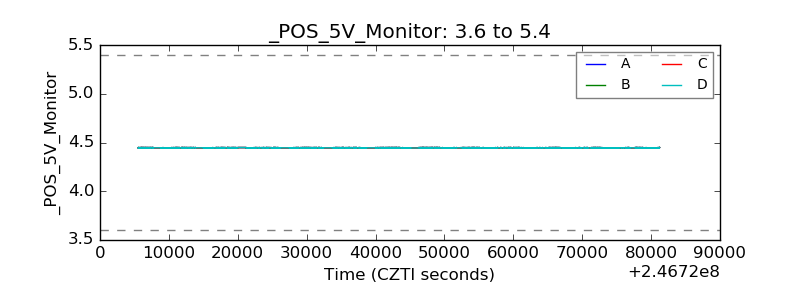 |
| _ROLL_ROT |  |
| _Roll_DEC |  |
| _Roll_RA | 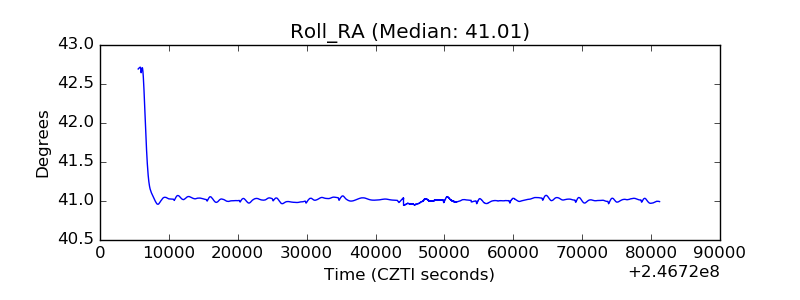 |
| Veto Counter |  |