| Param | Original file | Final file |
|---|---|---|
| Filename | modeM0/AS1T01_200T01_9000001638cztM0_level2.evt | modeM0/AS1T01_200T01_9000001638cztM0_level2_quad_clean.evt |
| Size (bytes) | 10,480,714,560 | 2,044,823,040 |
| Size | 9.8 GB | 1.9 GB |
| Events in quadrant A | 104,993,477 | 12,971,578 |
| Events in quadrant B | 65,157,044 | 13,963,869 |
| Events in quadrant C | 56,002,654 | 14,021,685 |
| Events in quadrant D | 83,498,676 | 13,067,757 |
| Mode M0 | |||
|---|---|---|---|
| Quadrant | BADHDUFLAG | Total packets | Discarded packets |
| A | 0 | 390897 | 0 |
| B | 0 | 271723 | 0 |
| C | 0 | 250416 | 0 |
| D | 0 | 326048 | 0 |
| Mode SS | |||
|---|---|---|---|
| Quadrant | BADHDUFLAG | Total packets | Discarded packets |
| A | 0 | 2352 | 0 |
| B | 0 | 2352 | 0 |
| C | 0 | 2352 | 0 |
| D | 0 | 2352 | 0 |
| Mode M9 | |||
|---|---|---|---|
| Quadrant | BADHDUFLAG | Total packets | Discarded packets |
| A | 0 | 148 | 0 |
| B | 0 | 148 | 0 |
| C | 0 | 148 | 0 |
| D | 0 | 148 | 0 |
| Quadrant | Total seconds | Saturated seconds | Saturation percentage |
|---|---|---|---|
| A | 115396 | 14485 | 12.552428% |
| B | 115396 | 3704 | 3.209817% |
| C | 115396 | 2191 | 1.898679% |
| D | 115396 | 6551 | 5.676973% |
Noise dominated data is calculated using 1-second bins in cleaned event files. If a bin has >2000 counts, and if more than 50% of those come from <1% of pixels, then it is considered to be noise-dominated and hence unusable.
| Quadrant | # 1 sec bins | Bins with >0 counts | Bins with >2000 counts | High rate bins dominated by noise | Noise dominated (total time) | Noise dominated (detector-on time) | Marked lightcurve |
|---|---|---|---|---|---|---|---|
| A | 130396 | 115420 | 9192 | 9192 | 7.05% | 7.96% |  |
| B | 130396 | 115420 | 1254 | 1254 | 0.96% | 1.09% |  |
| C | 130396 | 115421 | 954 | 954 | 0.73% | 0.83% |  |
| D | 130396 | 115421 | 4533 | 4533 | 3.48% | 3.93% |  |
Top three noisy pixels from each quadrant. If the there are fewer than three noisy pixels in the level2.evt file, extra rows are filled as -1
| Pixel properties | Quadrant properties | ||||||
|---|---|---|---|---|---|---|---|
| Quadrant | DetID | PixID | Counts | Sigma | Mean | Median | Sigma |
| A | 8 | 5 | 33364325 | 13216.97 | 12525 | 12234 | 2523.4 |
| A | 14 | 238 | 15255726 | 6040.78 | 12525 | 12234 | 2523.4 |
| A | 15 | 174 | 5742492 | 2270.82 | 12525 | 12234 | 2523.4 |
| B | 4 | 239 | 9509589 | 3876.07 | 13152 | 12803 | 2450.1 |
| B | 10 | 244 | 1211210 | 489.12 | 13152 | 12803 | 2450.1 |
| B | 15 | 204 | 990625 | 399.09 | 13152 | 12803 | 2450.1 |
| C | 4 | 254 | 5465968 | 1843.69 | 12874 | 12909 | 2957.7 |
| C | 1 | 3 | 139354 | 42.75 | 12874 | 12909 | 2957.7 |
| C | 7 | 238 | 111284 | 33.26 | 12874 | 12909 | 2957.7 |
| D | 1 | 52 | 12348109 | 4092.27 | 12582 | 12225 | 3014.4 |
| D | 8 | 195 | 8484636 | 2810.62 | 12582 | 12225 | 3014.4 |
| D | 10 | 253 | 2849742 | 941.31 | 12582 | 12225 | 3014.4 |
Histogram calculated using DETX and DETY for each event in the final _common_clean file
| Quadrant A |  |
 |
Quadrant B |
|---|---|---|---|
| Quadrant D |  |
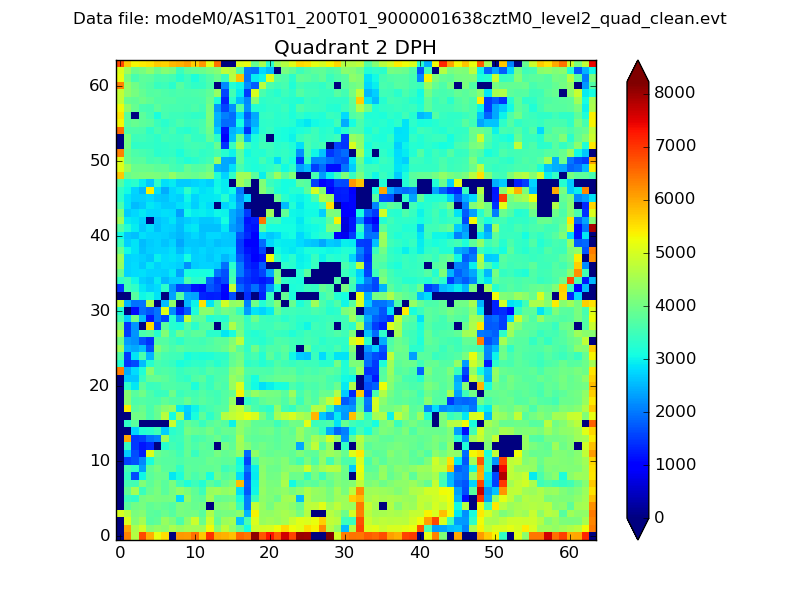 |
Quadrant C |
| Plot type | Count rate plots | Images |
|---|---|---|
| Comparison with Poisson distribution Blue bars denote a histogram of data divided into 1 sec bins. Red curve is a Poisson curve with rate = median count rate of data. |
 |
 |
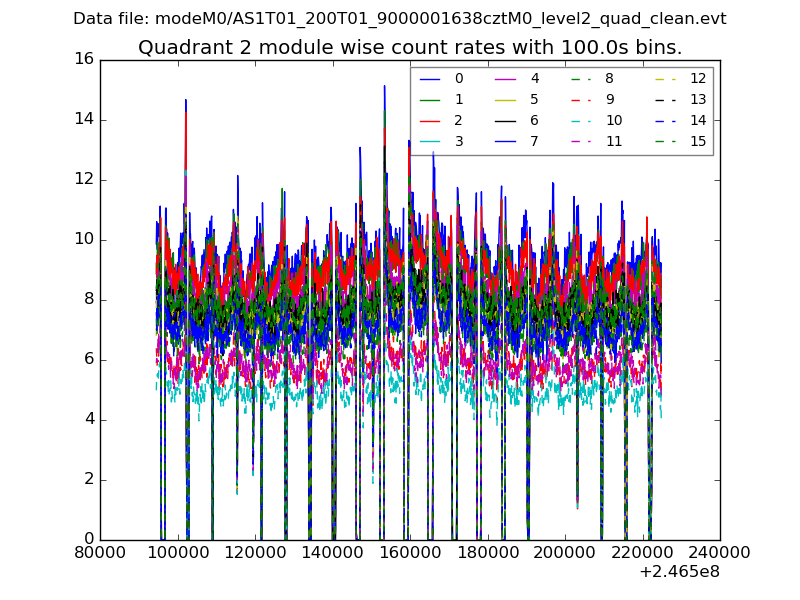
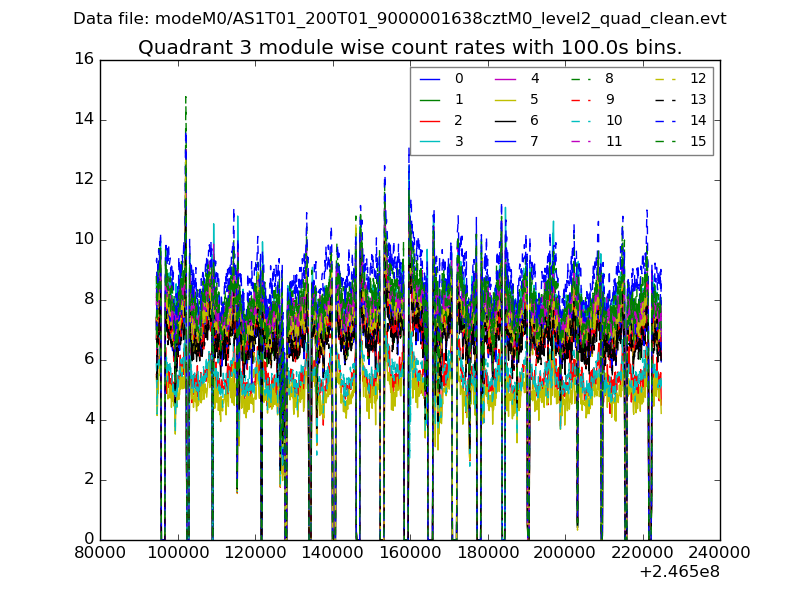
| Quadrant-wise count rates Data is divided into 100 sec bins |
 |
|
| Module-wise count rates for Quadrant A Data is divided into 100 sec bins |
 |
 |
| Module-wise count rates for Quadrant B Data is divided into 100 sec bins |
 |
 |
| Module-wise count rates for Quadrant C Data is divided into 100 sec bins |
 |
 |
| Module-wise count rates for Quadrant D Data is divided into 100 sec bins |
 |
 |
| Parameter | Plot |
|---|---|
| CZT HV Monitor |  |
| D_VDD |  |
| Temperature 1 |  |
| Veto HV Monitor |  |
| Veto LLD |  |
| Alpha Counter | 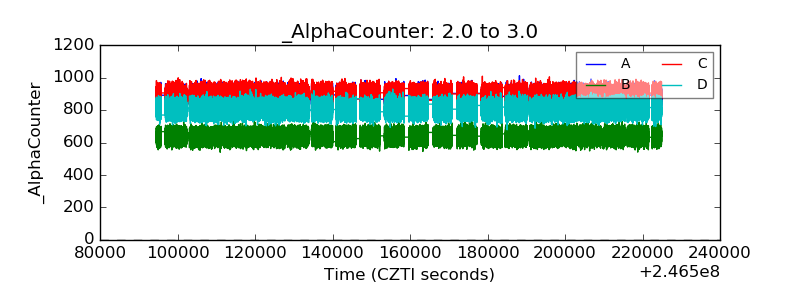 |
| _CPM_Rate |  |
| CZT Counter | 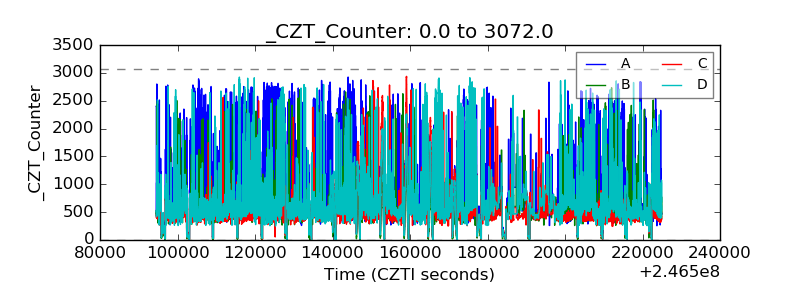 |
| +2.5 Volts monitor |  |
| +5 Volts monitor |  |
| _ROLL_ROT |  |
| _Roll_DEC |  |
| _Roll_RA |  |
| Veto Counter |  |