| Param | Original file | Final file |
|---|---|---|
| Filename | modeM0/AS1A04_171T01_9000001634cztM0_level2.evt | modeM0/AS1A04_171T01_9000001634cztM0_level2_quad_clean.evt |
| Size (bytes) | 13,340,473,920 | 1,910,980,800 |
| Size | 12.4 GB | 1.8 GB |
| Events in quadrant A | 116,558,091 | 11,578,722 |
| Events in quadrant B | 96,378,358 | 12,073,447 |
| Events in quadrant C | 72,109,573 | 12,085,855 |
| Events in quadrant D | 108,282,405 | 11,256,474 |
| Mode M9 | |||
|---|---|---|---|
| Quadrant | BADHDUFLAG | Total packets | Discarded packets |
| A | 0 | 221 | 0 |
| B | 0 | 221 | 0 |
| C | 0 | 221 | 0 |
| D | 0 | 221 | 0 |
| Mode M0 | |||
|---|---|---|---|
| Quadrant | BADHDUFLAG | Total packets | Discarded packets |
| A | 0 | 452181 | 0 |
| B | 0 | 390814 | 0 |
| C | 0 | 327148 | 0 |
| D | 0 | 428964 | 0 |
| Mode SS | |||
|---|---|---|---|
| Quadrant | BADHDUFLAG | Total packets | Discarded packets |
| A | 0 | 3230 | 0 |
| B | 0 | 3228 | 0 |
| C | 0 | 3232 | 0 |
| D | 0 | 3234 | 0 |
| Quadrant | Total seconds | Saturated seconds | Saturation percentage |
|---|---|---|---|
| A | 158746 | 12642 | 7.963665% |
| B | 158862 | 8161 | 5.137163% |
| C | 158918 | 2286 | 1.438478% |
| D | 158804 | 8709 | 5.484119% |
Noise dominated data is calculated using 1-second bins in cleaned event files. If a bin has >2000 counts, and if more than 50% of those come from <1% of pixels, then it is considered to be noise-dominated and hence unusable.
| Quadrant | # 1 sec bins | Bins with >0 counts | Bins with >2000 counts | High rate bins dominated by noise | Noise dominated (total time) | Noise dominated (detector-on time) | Marked lightcurve |
|---|---|---|---|---|---|---|---|
| A | 181727 | 159006 | 7401 | 7401 | 4.07% | 4.65% |  |
| B | 181727 | 159140 | 3154 | 3154 | 1.74% | 1.98% |  |
| C | 181727 | 159137 | 18 | 18 | 0.01% | 0.01% |  |
| D | 181727 | 159068 | 5441 | 5441 | 2.99% | 3.42% |  |
Top three noisy pixels from each quadrant. If the there are fewer than three noisy pixels in the level2.evt file, extra rows are filled as -1
| Pixel properties | Quadrant properties | ||||||
|---|---|---|---|---|---|---|---|
| Quadrant | DetID | PixID | Counts | Sigma | Mean | Median | Sigma |
| A | 15 | 239 | 20771699 | 5652.04 | 18196 | 17808 | 3671.9 |
| A | 8 | 5 | 15518844 | 4221.5 | 18196 | 17808 | 3671.9 |
| A | 8 | 15 | 7856088 | 2134.65 | 18196 | 17808 | 3671.9 |
| B | 4 | 239 | 18928721 | 5334.94 | 18703 | 18220 | 3544.7 |
| B | 15 | 204 | 1131724 | 314.14 | 18703 | 18220 | 3544.7 |
| B | 4 | 80 | 698793 | 192.0 | 18703 | 18220 | 3544.7 |
| C | 13 | 61 | 135274 | 27.35 | 18429 | 18507 | 4269.5 |
| C | 1 | 3 | 117327 | 23.15 | 18429 | 18507 | 4269.5 |
| C | 12 | 4 | 68580 | 11.73 | 18429 | 18507 | 4269.5 |
| D | 1 | 52 | 8529753 | 1973.7 | 17912 | 17414 | 4312.9 |
| D | 2 | 14 | 5403272 | 1248.79 | 17912 | 17414 | 4312.9 |
| D | 10 | 157 | 5042436 | 1165.12 | 17912 | 17414 | 4312.9 |
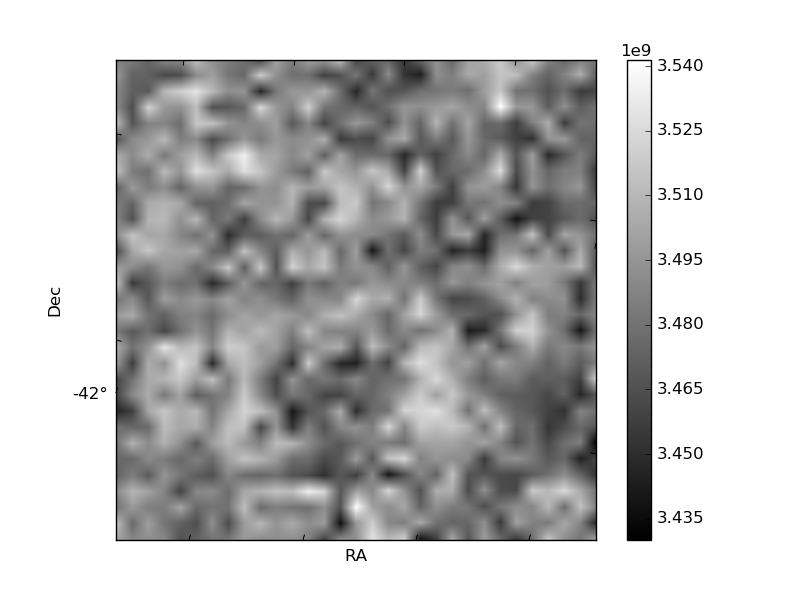
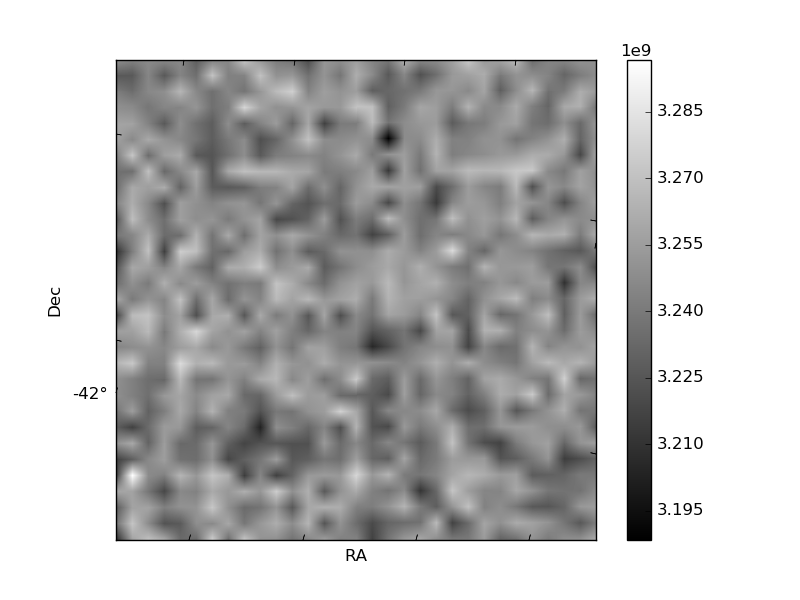
Histogram calculated using DETX and DETY for each event in the final _common_clean file
| Quadrant A |  |
 |
Quadrant B |
|---|---|---|---|
| Quadrant D |  |
 |
Quadrant C |
| Plot type | Count rate plots | Images |
|---|---|---|
| Comparison with Poisson distribution Blue bars denote a histogram of data divided into 1 sec bins. Red curve is a Poisson curve with rate = median count rate of data. |
 |
 |
| Quadrant-wise count rates Data is divided into 100 sec bins |
 |
|
| Module-wise count rates for Quadrant A Data is divided into 100 sec bins |
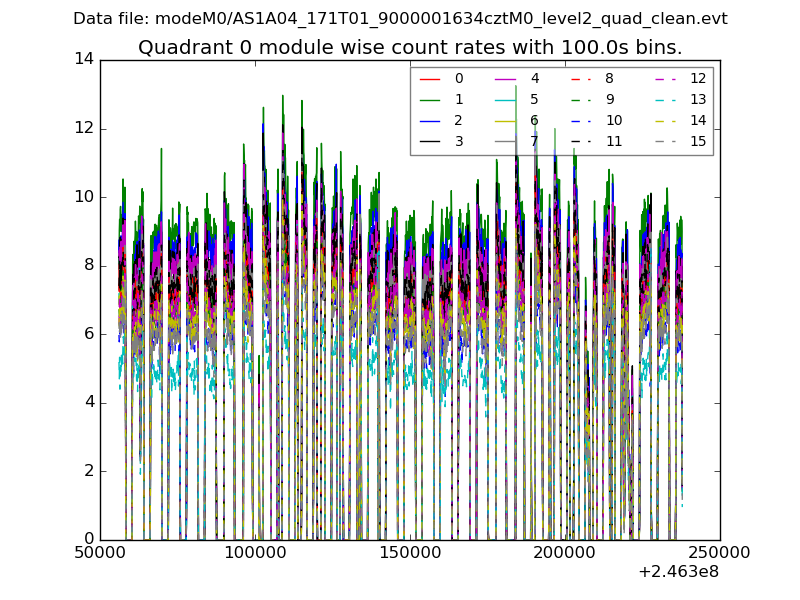 |
 |
| Module-wise count rates for Quadrant B Data is divided into 100 sec bins |
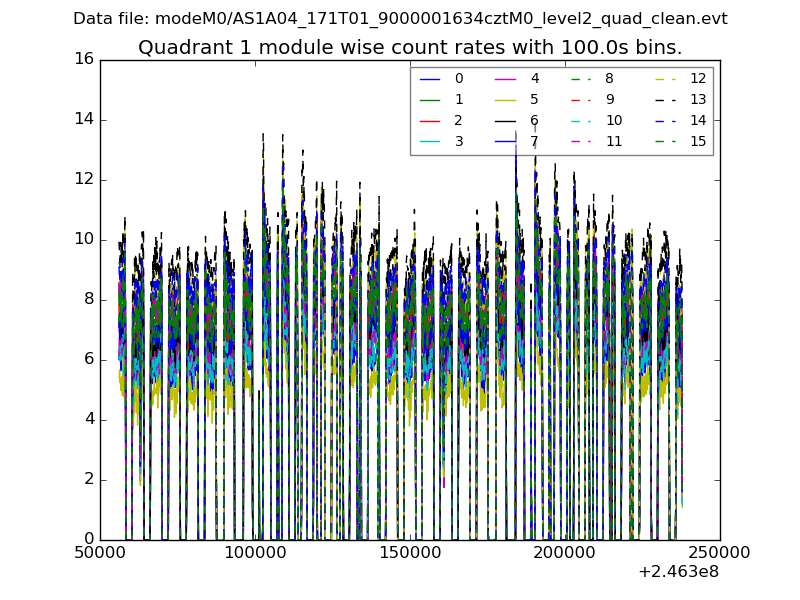 |
 |
| Module-wise count rates for Quadrant C Data is divided into 100 sec bins |
 |
 |
| Module-wise count rates for Quadrant D Data is divided into 100 sec bins |
 |
 |
| Parameter | Plot |
|---|---|
| CZT HV Monitor |  |
| D_VDD |  |
| Temperature 1 | 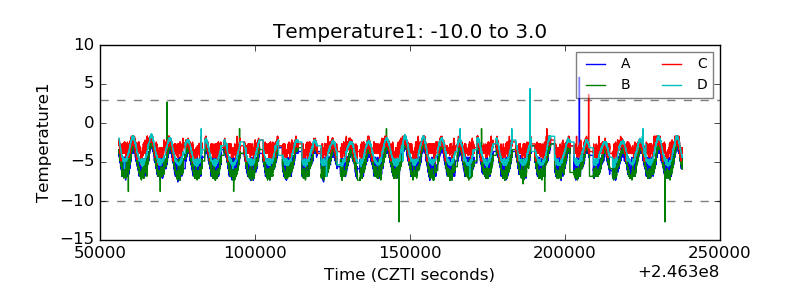 |
| Veto HV Monitor |  |
| Veto LLD |  |
| Alpha Counter |  |
| _CPM_Rate |  |
| CZT Counter |  |
| +2.5 Volts monitor |  |
| +5 Volts monitor |  |
| _ROLL_ROT |  |
| _Roll_DEC |  |
| _Roll_RA | 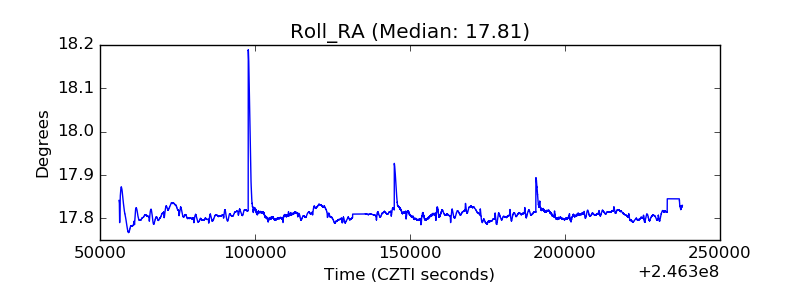 |
| Veto Counter |  |