| Param | Original file | Final file |
|---|---|---|
| Filename | modeM0/AS1A04_042T01_9000001630cztM0_level2.evt | modeM0/AS1A04_042T01_9000001630cztM0_level2_quad_clean.evt |
| Size (bytes) | 4,089,283,200 | 467,467,200 |
| Size | 3.8 GB | 445.8 MB |
| Events in quadrant A | 35,659,634 | 2,747,098 |
| Events in quadrant B | 28,184,264 | 2,925,770 |
| Events in quadrant C | 18,927,080 | 2,945,043 |
| Events in quadrant D | 38,268,028 | 2,669,488 |
| Mode M0 | |||
|---|---|---|---|
| Quadrant | BADHDUFLAG | Total packets | Discarded packets |
| A | 0 | 134070 | 0 |
| B | 0 | 111111 | 0 |
| C | 0 | 85753 | 0 |
| D | 0 | 142795 | 0 |
| Mode M9 | |||
|---|---|---|---|
| Quadrant | BADHDUFLAG | Total packets | Discarded packets |
| A | 0 | 47 | 0 |
| B | 0 | 47 | 0 |
| C | 0 | 47 | 0 |
| D | 0 | 47 | 0 |
| Mode SS | |||
|---|---|---|---|
| Quadrant | BADHDUFLAG | Total packets | Discarded packets |
| A | 0 | 850 | 0 |
| B | 0 | 852 | 0 |
| C | 0 | 852 | 0 |
| D | 0 | 852 | 0 |
| Quadrant | Total seconds | Saturated seconds | Saturation percentage |
|---|---|---|---|
| A | 41729 | 4383 | 10.503487% |
| B | 41771 | 2548 | 6.099926% |
| C | 41804 | 312 | 0.746340% |
| D | 41782 | 2644 | 6.328084% |
Noise dominated data is calculated using 1-second bins in cleaned event files. If a bin has >2000 counts, and if more than 50% of those come from <1% of pixels, then it is considered to be noise-dominated and hence unusable.
| Quadrant | # 1 sec bins | Bins with >0 counts | Bins with >2000 counts | High rate bins dominated by noise | Noise dominated (total time) | Noise dominated (detector-on time) | Marked lightcurve |
|---|---|---|---|---|---|---|---|
| A | 49127 | 41801 | 2491 | 2491 | 5.07% | 5.96% | 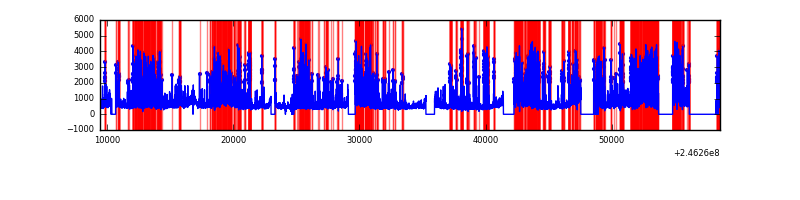 |
| B | 49127 | 41849 | 1138 | 1138 | 2.32% | 2.72% |  |
| C | 49127 | 41877 | 4 | 4 | 0.01% | 0.01% |  |
| D | 49127 | 41861 | 2411 | 2411 | 4.91% | 5.76% |  |
Top three noisy pixels from each quadrant. If the there are fewer than three noisy pixels in the level2.evt file, extra rows are filled as -1
| Pixel properties | Quadrant properties | ||||||
|---|---|---|---|---|---|---|---|
| Quadrant | DetID | PixID | Counts | Sigma | Mean | Median | Sigma |
| A | 14 | 238 | 7549325 | 7815.39 | 4766 | 4659 | 965.4 |
| A | 8 | 15 | 5021347 | 5196.7 | 4766 | 4659 | 965.4 |
| A | 8 | 5 | 4392471 | 4545.26 | 4766 | 4659 | 965.4 |
| B | 4 | 239 | 5126227 | 5508.46 | 4909 | 4794 | 929.7 |
| B | 10 | 16 | 1515952 | 1625.36 | 4909 | 4794 | 929.7 |
| B | 15 | 204 | 543300 | 579.2 | 4909 | 4794 | 929.7 |
| C | 14 | 234 | 41736 | 33.02 | 4821 | 4835 | 1117.5 |
| C | 9 | 204 | 41328 | 32.66 | 4821 | 4835 | 1117.5 |
| C | 13 | 61 | 36224 | 28.09 | 4821 | 4835 | 1117.5 |
| D | 10 | 157 | 13889616 | 12141.34 | 4713 | 4573 | 1143.6 |
| D | 12 | 16 | 2813669 | 2456.33 | 4713 | 4573 | 1143.6 |
| D | 1 | 52 | 640059 | 555.68 | 4713 | 4573 | 1143.6 |
Histogram calculated using DETX and DETY for each event in the final _common_clean file
| Quadrant A | 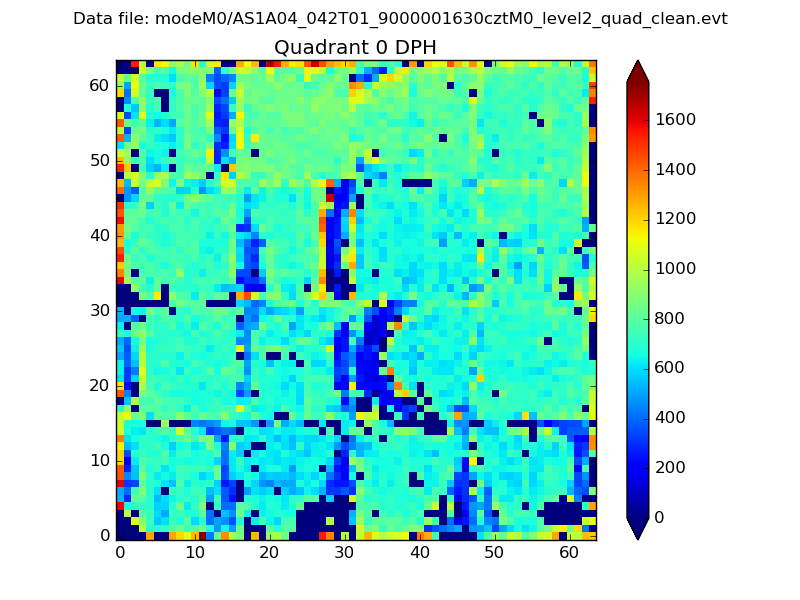 |
 |
Quadrant B |
|---|---|---|---|
| Quadrant D |  |
 |
Quadrant C |
| Plot type | Count rate plots | Images |
|---|---|---|
| Comparison with Poisson distribution Blue bars denote a histogram of data divided into 1 sec bins. Red curve is a Poisson curve with rate = median count rate of data. |
 |
 |
| Quadrant-wise count rates Data is divided into 100 sec bins |
 |
|
| Module-wise count rates for Quadrant A Data is divided into 100 sec bins |
 |
 |
| Module-wise count rates for Quadrant B Data is divided into 100 sec bins |
 |
 |
| Module-wise count rates for Quadrant C Data is divided into 100 sec bins |
 |
 |
| Module-wise count rates for Quadrant D Data is divided into 100 sec bins |
 |
 |
| Parameter | Plot |
|---|---|
| CZT HV Monitor |  |
| D_VDD |  |
| Temperature 1 |  |
| Veto HV Monitor |  |
| Veto LLD |  |
| Alpha Counter |  |
| _CPM_Rate |  |
| CZT Counter |  |
| +2.5 Volts monitor |  |
| +5 Volts monitor |  |
| _ROLL_ROT |  |
| _Roll_DEC |  |
| _Roll_RA |  |
| Veto Counter | 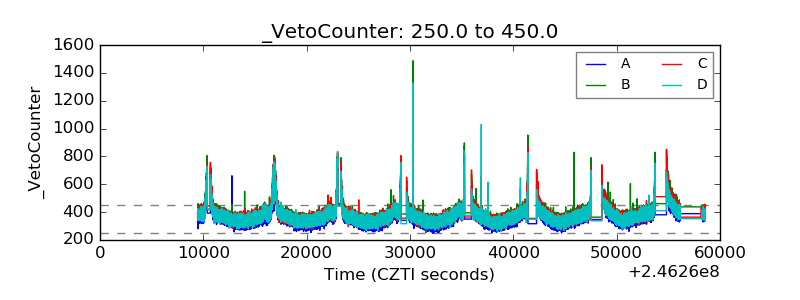 |