| Param | Original file | Final file |
|---|---|---|
| Filename | modeM0/AS1A04_145T03_9000001624cztM0_level2.evt | modeM0/AS1A04_145T03_9000001624cztM0_level2_quad_clean.evt |
| Size (bytes) | 673,940,160 | 89,320,320 |
| Size | 642.7 MB | 85.2 MB |
| Events in quadrant A | 5,713,118 | 550,186 |
| Events in quadrant B | 5,286,809 | 551,903 |
| Events in quadrant C | 3,593,406 | 553,099 |
| Events in quadrant D | 5,294,162 | 512,103 |
| Mode M0 | |||
|---|---|---|---|
| Quadrant | BADHDUFLAG | Total packets | Discarded packets |
| A | 0 | 22099 | 0 |
| B | 0 | 20771 | 0 |
| C | 0 | 16107 | 0 |
| D | 0 | 20921 | 0 |
| Mode SS | |||
|---|---|---|---|
| Quadrant | BADHDUFLAG | Total packets | Discarded packets |
| A | 0 | 154 | 0 |
| B | 0 | 158 | 0 |
| C | 0 | 152 | 0 |
| D | 0 | 156 | 0 |
| Quadrant | Total seconds | Saturated seconds | Saturation percentage |
|---|---|---|---|
| A | 7711 | 542 | 7.028920% |
| B | 7714 | 557 | 7.220638% |
| C | 7740 | 223 | 2.881137% |
| D | 7715 | 534 | 6.921581% |
Noise dominated data is calculated using 1-second bins in cleaned event files. If a bin has >2000 counts, and if more than 50% of those come from <1% of pixels, then it is considered to be noise-dominated and hence unusable.
| Quadrant | # 1 sec bins | Bins with >0 counts | Bins with >2000 counts | High rate bins dominated by noise | Noise dominated (total time) | Noise dominated (detector-on time) | Marked lightcurve |
|---|---|---|---|---|---|---|---|
| A | 7927 | 7747 | 161 | 161 | 2.03% | 2.08% | 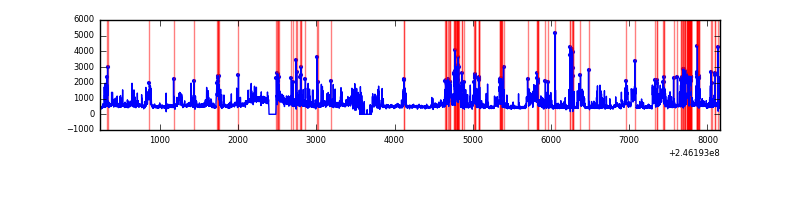 |
| B | 7927 | 7754 | 204 | 204 | 2.57% | 2.63% |  |
| C | 7927 | 7771 | 0 | 0 | 0.00% | 0.00% | 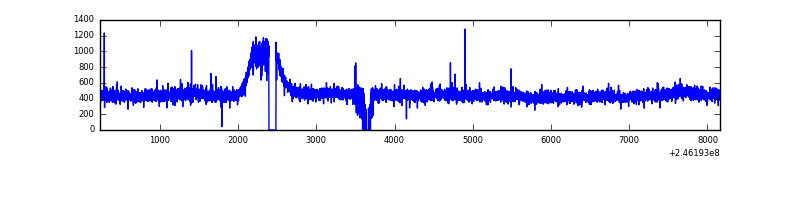 |
| D | 7927 | 7756 | 244 | 244 | 3.08% | 3.15% |  |
Top three noisy pixels from each quadrant. If the there are fewer than three noisy pixels in the level2.evt file, extra rows are filled as -1
| Pixel properties | Quadrant properties | ||||||
|---|---|---|---|---|---|---|---|
| Quadrant | DetID | PixID | Counts | Sigma | Mean | Median | Sigma |
| A | 8 | 5 | 1508363 | 7885.57 | 928 | 906 | 191.2 |
| A | 14 | 238 | 256508 | 1337.06 | 928 | 906 | 191.2 |
| A | 0 | 23 | 192588 | 1002.7 | 928 | 906 | 191.2 |
| B | 4 | 239 | 1402916 | 7865.96 | 919 | 897 | 178.2 |
| B | 15 | 204 | 110382 | 614.26 | 919 | 897 | 178.2 |
| B | 4 | 80 | 56021 | 309.27 | 919 | 897 | 178.2 |
| C | 14 | 67 | 9349 | 39.27 | 913 | 916 | 214.8 |
| C | 8 | 128 | 9094 | 38.08 | 913 | 916 | 214.8 |
| C | 13 | 61 | 6849 | 27.63 | 913 | 916 | 214.8 |
| D | 13 | 152 | 636482 | 2939.76 | 891 | 866 | 216.2 |
| D | 10 | 253 | 435094 | 2008.33 | 891 | 866 | 216.2 |
| D | 1 | 52 | 409529 | 1890.09 | 891 | 866 | 216.2 |
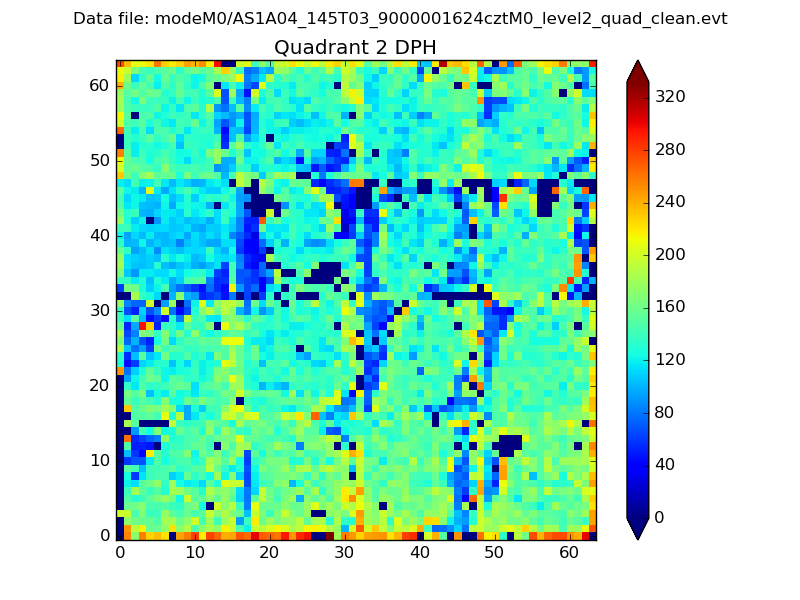
Histogram calculated using DETX and DETY for each event in the final _common_clean file
| Quadrant A |  |
 |
Quadrant B |
|---|---|---|---|
| Quadrant D |  |
 |
Quadrant C |
| Plot type | Count rate plots | Images |
|---|---|---|
| Comparison with Poisson distribution Blue bars denote a histogram of data divided into 1 sec bins. Red curve is a Poisson curve with rate = median count rate of data. |
 |
 |
| Quadrant-wise count rates Data is divided into 100 sec bins |
 |
|
| Module-wise count rates for Quadrant A Data is divided into 100 sec bins |
 |
 |
| Module-wise count rates for Quadrant B Data is divided into 100 sec bins |
 |
 |
| Module-wise count rates for Quadrant C Data is divided into 100 sec bins |
 |
 |
| Module-wise count rates for Quadrant D Data is divided into 100 sec bins |
 |
 |
| Parameter | Plot |
|---|---|
| CZT HV Monitor |  |
| D_VDD | 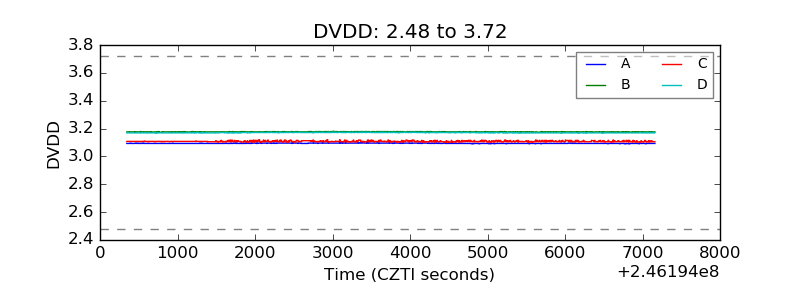 |
| Temperature 1 | 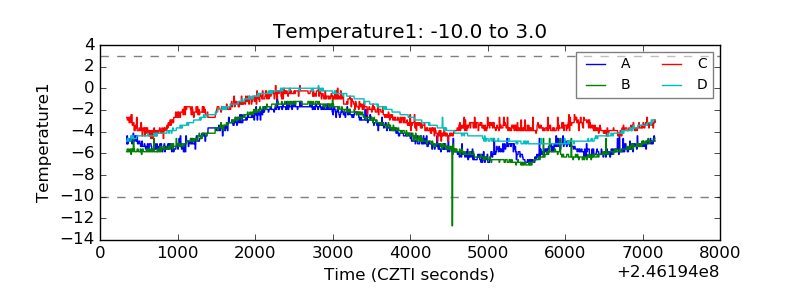 |
| Veto HV Monitor |  |
| Veto LLD |  |
| Alpha Counter |  |
| _CPM_Rate |  |
| CZT Counter |  |
| +2.5 Volts monitor |  |
| +5 Volts monitor |  |
| _ROLL_ROT | 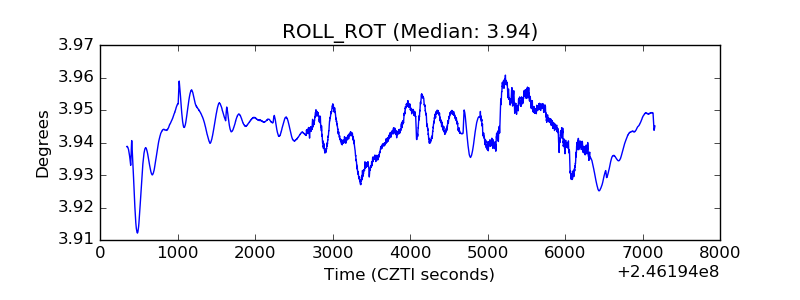 |
| _Roll_DEC | 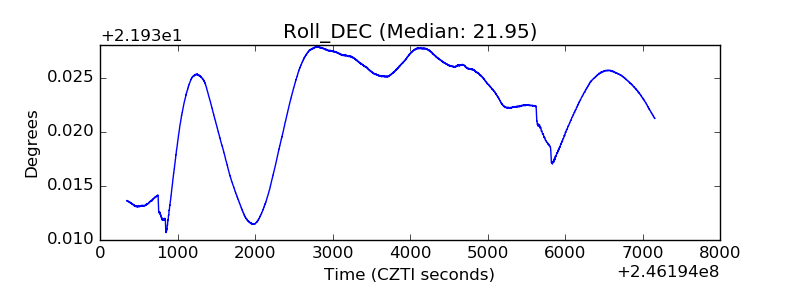 |
| _Roll_RA |  |
| Veto Counter |  |