| Param | Original file | Final file |
|---|---|---|
| Filename | modeM0/AS1A04_058T02_9000001626cztM0_level2.evt | modeM0/AS1A04_058T02_9000001626cztM0_level2_quad_clean.evt |
| Size (bytes) | 1,350,685,440 | 225,702,720 |
| Size | 1.3 GB | 215.2 MB |
| Events in quadrant A | 12,928,131 | 1,394,954 |
| Events in quadrant B | 10,412,965 | 1,467,695 |
| Events in quadrant C | 6,812,329 | 1,525,848 |
| Events in quadrant D | 9,748,814 | 1,419,804 |
| Mode M0 | |||
|---|---|---|---|
| Quadrant | BADHDUFLAG | Total packets | Discarded packets |
| A | 0 | 48805 | 0 |
| B | 0 | 40916 | 0 |
| C | 0 | 30803 | 0 |
| D | 0 | 39402 | 0 |
| Mode M9 | |||
|---|---|---|---|
| Quadrant | BADHDUFLAG | Total packets | Discarded packets |
| A | 0 | 18 | 0 |
| B | 0 | 18 | 0 |
| C | 0 | 18 | 0 |
| D | 0 | 18 | 0 |
| Mode SS | |||
|---|---|---|---|
| Quadrant | BADHDUFLAG | Total packets | Discarded packets |
| A | 0 | 300 | 0 |
| B | 0 | 298 | 0 |
| C | 0 | 298 | 0 |
| D | 0 | 300 | 0 |
| Quadrant | Total seconds | Saturated seconds | Saturation percentage |
|---|---|---|---|
| A | 14884 | 1776 | 11.932276% |
| B | 14883 | 1060 | 7.122220% |
| C | 14891 | 126 | 0.846149% |
| D | 14885 | 521 | 3.500168% |
Noise dominated data is calculated using 1-second bins in cleaned event files. If a bin has >2000 counts, and if more than 50% of those come from <1% of pixels, then it is considered to be noise-dominated and hence unusable.
| Quadrant | # 1 sec bins | Bins with >0 counts | Bins with >2000 counts | High rate bins dominated by noise | Noise dominated (total time) | Noise dominated (detector-on time) | Marked lightcurve |
|---|---|---|---|---|---|---|---|
| A | 19775 | 14969 | 1210 | 1210 | 6.12% | 8.08% |  |
| B | 19775 | 14960 | 601 | 601 | 3.04% | 4.02% |  |
| C | 19775 | 14960 | 36 | 36 | 0.18% | 0.24% |  |
| D | 19775 | 14957 | 339 | 339 | 1.71% | 2.27% | 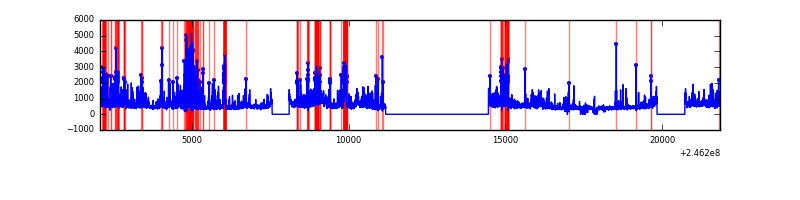 |
Top three noisy pixels from each quadrant. If the there are fewer than three noisy pixels in the level2.evt file, extra rows are filled as -1
| Pixel properties | Quadrant properties | ||||||
|---|---|---|---|---|---|---|---|
| Quadrant | DetID | PixID | Counts | Sigma | Mean | Median | Sigma |
| A | 8 | 5 | 2501233 | 7604.94 | 1627 | 1593 | 328.7 |
| A | 0 | 23 | 1949652 | 5926.8 | 1627 | 1593 | 328.7 |
| A | 8 | 15 | 1301885 | 3956.02 | 1627 | 1593 | 328.7 |
| B | 4 | 239 | 2914870 | 9159.53 | 1684 | 1641 | 318.1 |
| B | 15 | 204 | 388131 | 1215.17 | 1684 | 1641 | 318.1 |
| B | 0 | 219 | 182045 | 567.21 | 1684 | 1641 | 318.1 |
| C | 9 | 204 | 143005 | 361.56 | 1686 | 1691 | 390.8 |
| C | 0 | 207 | 72400 | 180.91 | 1686 | 1691 | 390.8 |
| C | 13 | 61 | 12541 | 27.76 | 1686 | 1691 | 390.8 |
| D | 1 | 52 | 748189 | 1876.49 | 1658 | 1608 | 397.9 |
| D | 13 | 104 | 452883 | 1134.25 | 1658 | 1608 | 397.9 |
| D | 7 | 71 | 296295 | 740.68 | 1658 | 1608 | 397.9 |
Histogram calculated using DETX and DETY for each event in the final _common_clean file
| Quadrant A |  |
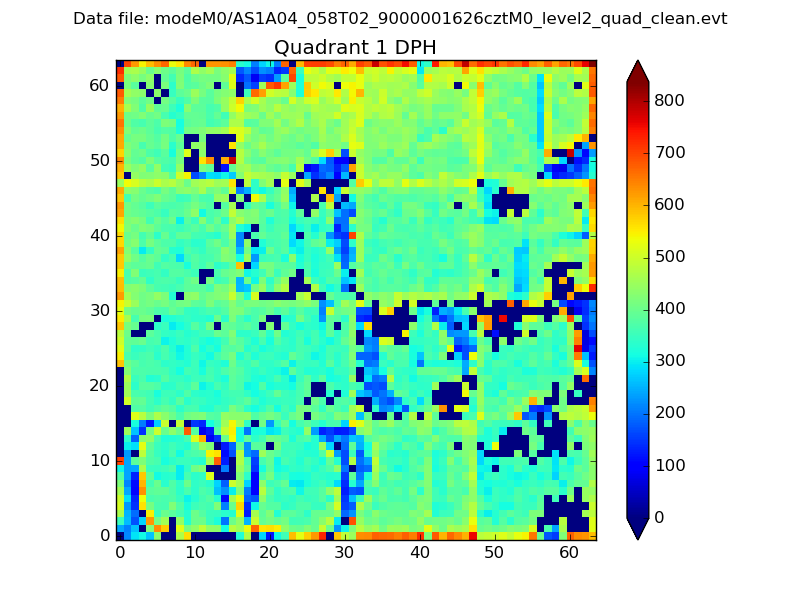 |
Quadrant B |
|---|---|---|---|
| Quadrant D |  |
 |
Quadrant C |
| Plot type | Count rate plots | Images |
|---|---|---|
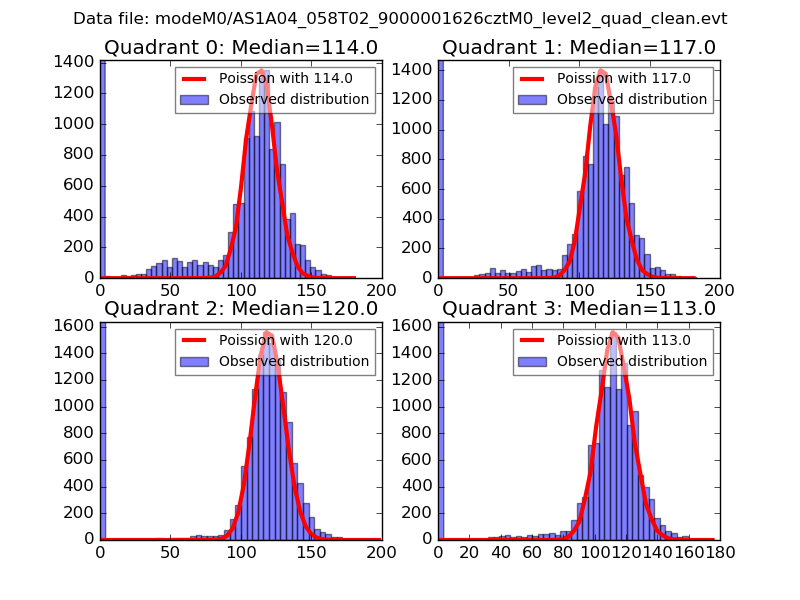
| Comparison with Poisson distribution Blue bars denote a histogram of data divided into 1 sec bins. Red curve is a Poisson curve with rate = median count rate of data. |
 |
 |
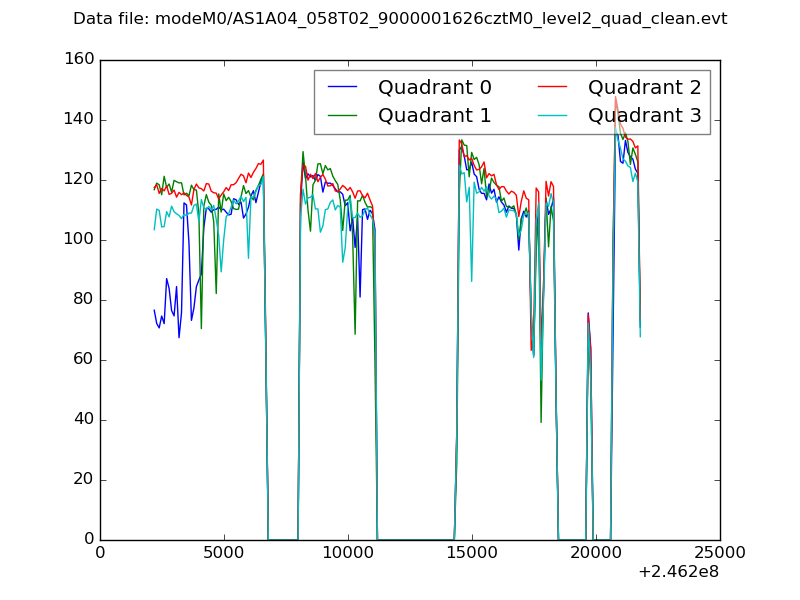
| Quadrant-wise count rates Data is divided into 100 sec bins |
 |
|
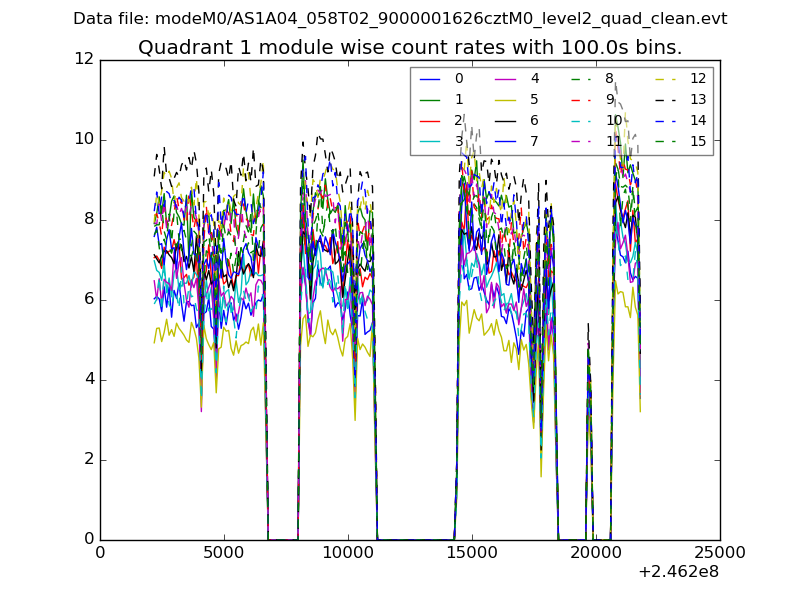
| Module-wise count rates for Quadrant A Data is divided into 100 sec bins |
 |
 |
| Module-wise count rates for Quadrant B Data is divided into 100 sec bins |
 |
 |
| Module-wise count rates for Quadrant C Data is divided into 100 sec bins |
 |
 |
| Module-wise count rates for Quadrant D Data is divided into 100 sec bins |
 |
 |
| Parameter | Plot |
|---|---|
| CZT HV Monitor |  |
| D_VDD |  |
| Temperature 1 | 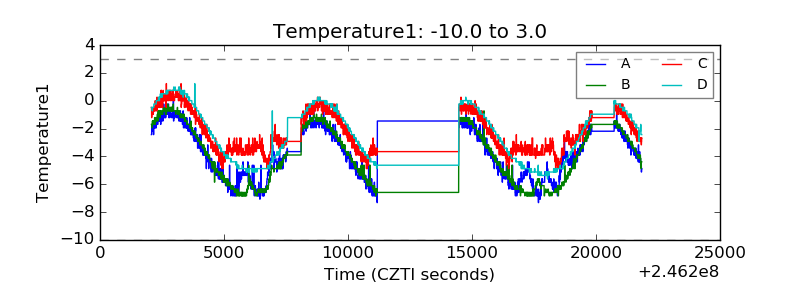 |
| Veto HV Monitor | 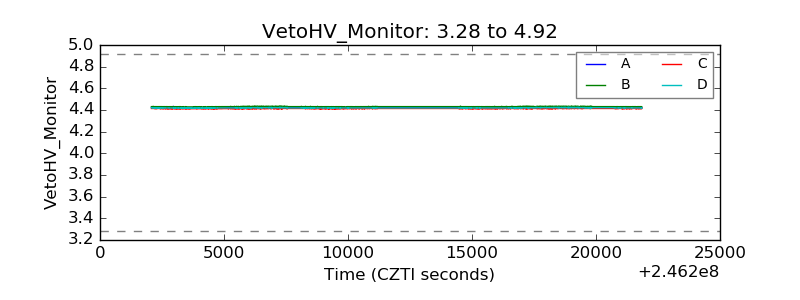 |
| Veto LLD |  |
| Alpha Counter |  |
| _CPM_Rate |  |
| CZT Counter |  |
| +2.5 Volts monitor | 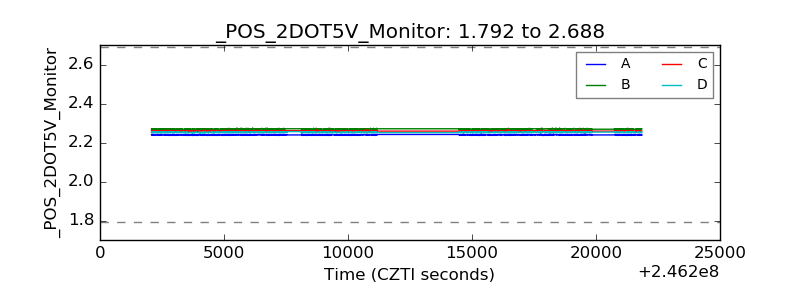 |
| +5 Volts monitor |  |
| _ROLL_ROT |  |
| _Roll_DEC |  |
| _Roll_RA |  |
| Veto Counter |  |