| Param | Original file | Final file |
|---|---|---|
| Filename | modeM0/AS1A04_058T01_9000001628cztM0_level2.evt | modeM0/AS1A04_058T01_9000001628cztM0_level2_quad_clean.evt |
| Size (bytes) | 2,004,693,120 | 330,171,840 |
| Size | 1.9 GB | 314.9 MB |
| Events in quadrant A | 18,775,109 | 1,975,243 |
| Events in quadrant B | 14,175,551 | 2,156,205 |
| Events in quadrant C | 10,422,413 | 2,226,868 |
| Events in quadrant D | 15,765,964 | 2,034,629 |
| Mode M9 | |||
|---|---|---|---|
| Quadrant | BADHDUFLAG | Total packets | Discarded packets |
| A | 0 | 55 | 0 |
| B | 0 | 56 | 0 |
| C | 0 | 54 | 0 |
| D | 0 | 55 | 0 |
| Mode SS | |||
|---|---|---|---|
| Quadrant | BADHDUFLAG | Total packets | Discarded packets |
| A | 0 | 474 | 0 |
| B | 0 | 478 | 0 |
| C | 0 | 484 | 0 |
| D | 0 | 482 | 0 |
| Mode M0 | |||
|---|---|---|---|
| Quadrant | BADHDUFLAG | Total packets | Discarded packets |
| A | 0 | 71272 | 0 |
| B | 0 | 57851 | 0 |
| C | 0 | 47902 | 0 |
| D | 0 | 63604 | 0 |
| Quadrant | Total seconds | Saturated seconds | Saturation percentage |
|---|---|---|---|
| A | 23241 | 2459 | 10.580440% |
| B | 23314 | 929 | 3.984730% |
| C | 23440 | 120 | 0.511945% |
| D | 23297 | 782 | 3.356655% |
Noise dominated data is calculated using 1-second bins in cleaned event files. If a bin has >2000 counts, and if more than 50% of those come from <1% of pixels, then it is considered to be noise-dominated and hence unusable.
| Quadrant | # 1 sec bins | Bins with >0 counts | Bins with >2000 counts | High rate bins dominated by noise | Noise dominated (total time) | Noise dominated (detector-on time) | Marked lightcurve |
|---|---|---|---|---|---|---|---|
| A | 46419 | 23633 | 1506 | 1506 | 3.24% | 6.37% |  |
| B | 46419 | 23726 | 404 | 404 | 0.87% | 1.70% |  |
| C | 46419 | 23828 | 6 | 6 | 0.01% | 0.03% | 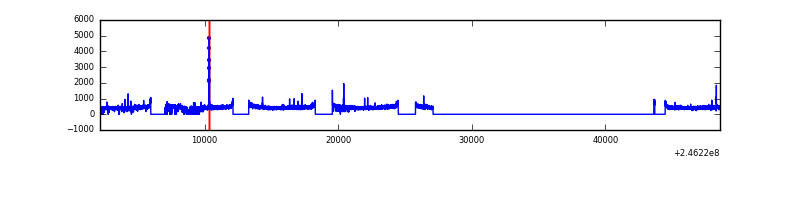 |
| D | 46419 | 23690 | 453 | 453 | 0.98% | 1.91% |  |
Top three noisy pixels from each quadrant. If the there are fewer than three noisy pixels in the level2.evt file, extra rows are filled as -1
| Pixel properties | Quadrant properties | ||||||
|---|---|---|---|---|---|---|---|
| Quadrant | DetID | PixID | Counts | Sigma | Mean | Median | Sigma |
| A | 14 | 238 | 4572144 | 8975.97 | 2542 | 2485 | 509.1 |
| A | 8 | 5 | 2754517 | 5405.69 | 2542 | 2485 | 509.1 |
| A | 8 | 15 | 1451069 | 2845.39 | 2542 | 2485 | 509.1 |
| B | 4 | 239 | 2729321 | 5540.17 | 2681 | 2615 | 492.2 |
| B | 15 | 204 | 242480 | 487.36 | 2681 | 2615 | 492.2 |
| B | 4 | 80 | 168045 | 336.12 | 2681 | 2615 | 492.2 |
| C | 5 | 128 | 28491 | 42.79 | 2655 | 2668 | 603.5 |
| C | 12 | 4 | 19985 | 28.69 | 2655 | 2668 | 603.5 |
| C | 13 | 61 | 19810 | 28.4 | 2655 | 2668 | 603.5 |
| D | 10 | 157 | 1883494 | 2877.42 | 2543 | 2487 | 653.7 |
| D | 12 | 16 | 946624 | 1444.27 | 2543 | 2487 | 653.7 |
| D | 1 | 52 | 703127 | 1071.79 | 2543 | 2487 | 653.7 |
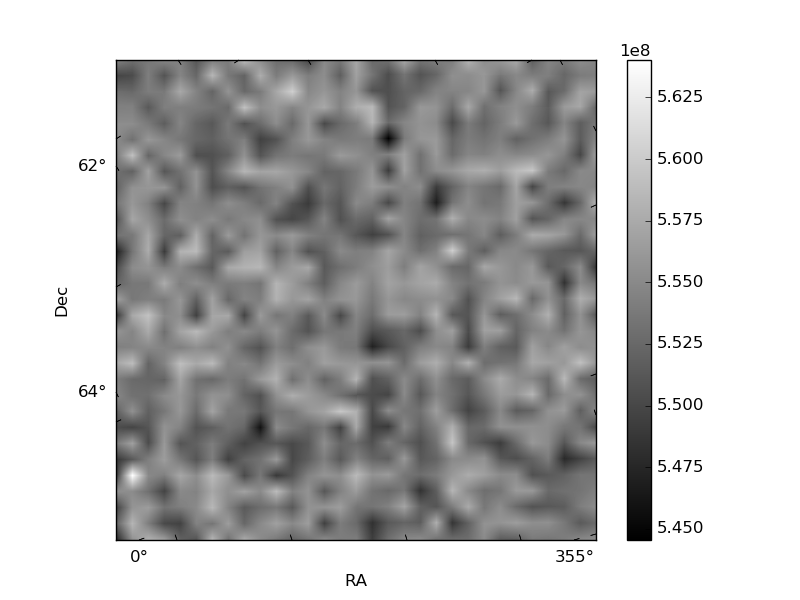
Histogram calculated using DETX and DETY for each event in the final _common_clean file
| Quadrant A | 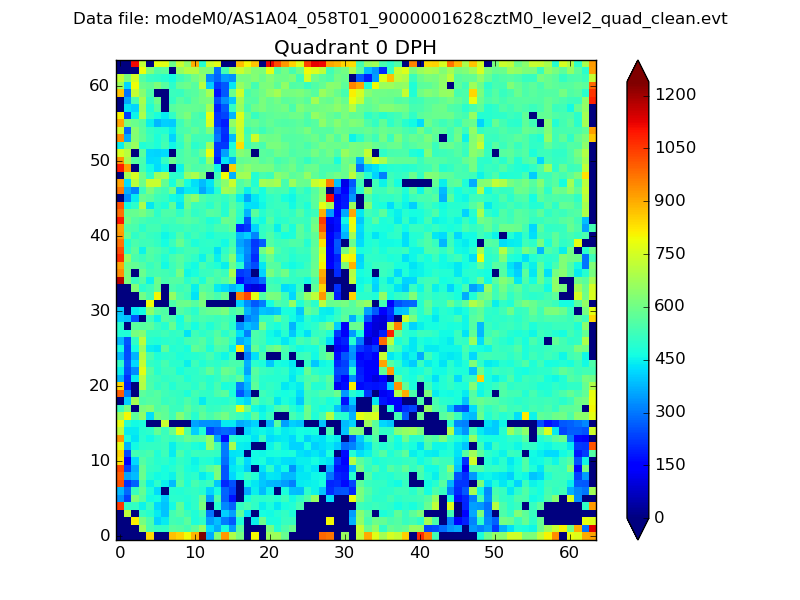 |
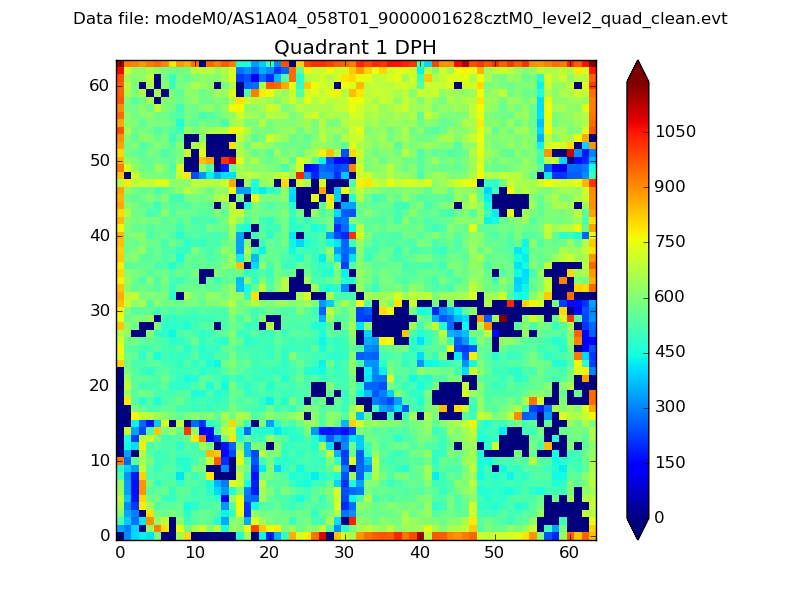 |
Quadrant B |
|---|---|---|---|
| Quadrant D |  |
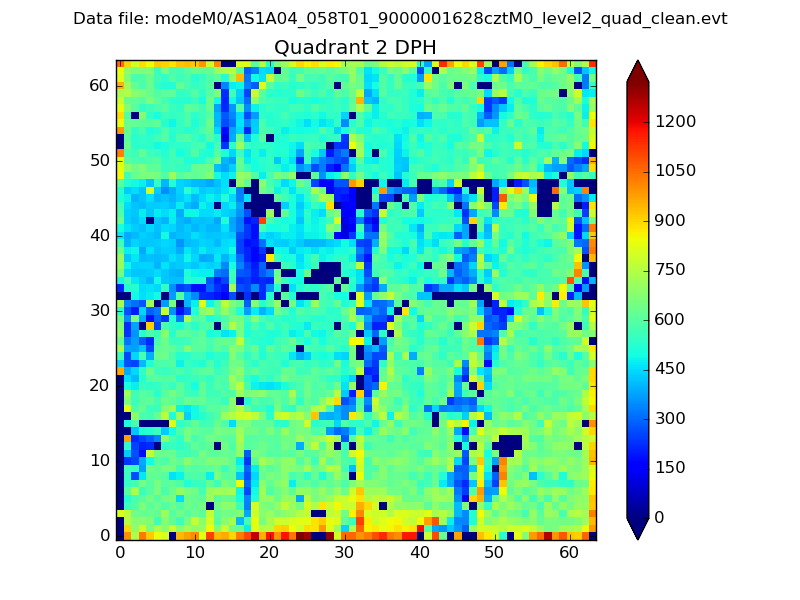 |
Quadrant C |
| Plot type | Count rate plots | Images |
|---|---|---|
| Comparison with Poisson distribution Blue bars denote a histogram of data divided into 1 sec bins. Red curve is a Poisson curve with rate = median count rate of data. |
 |
 |
| Quadrant-wise count rates Data is divided into 100 sec bins |
 |
|
| Module-wise count rates for Quadrant A Data is divided into 100 sec bins |
 |
 |
| Module-wise count rates for Quadrant B Data is divided into 100 sec bins |
 |
 |
| Module-wise count rates for Quadrant C Data is divided into 100 sec bins |
 |
 |
| Module-wise count rates for Quadrant D Data is divided into 100 sec bins |
 |
 |
| Parameter | Plot |
|---|---|
| CZT HV Monitor |  |
| D_VDD |  |
| Temperature 1 | 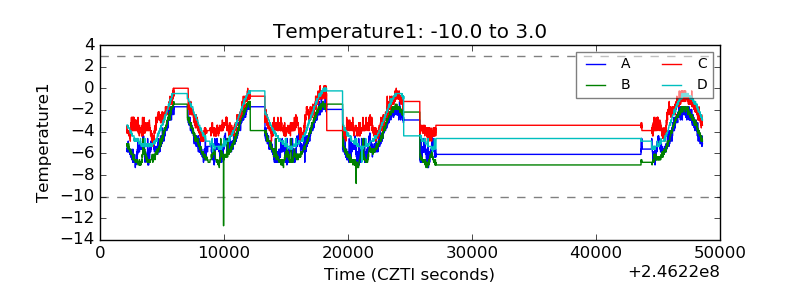 |
| Veto HV Monitor |  |
| Veto LLD | 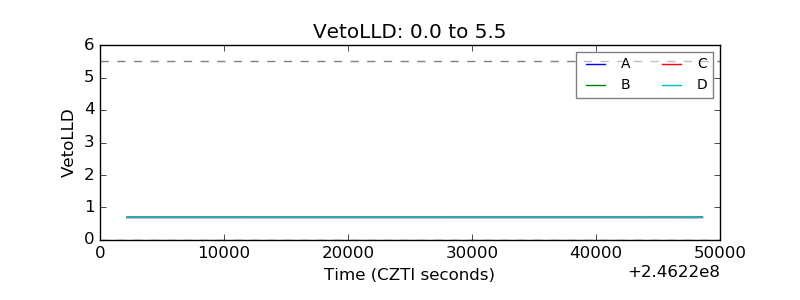 |
| Alpha Counter |  |
| _CPM_Rate |  |
| CZT Counter |  |
| +2.5 Volts monitor |  |
| +5 Volts monitor |  |
| _ROLL_ROT |  |
| _Roll_DEC |  |
| _Roll_RA |  |
| Veto Counter |  |