| Param | Original file | Final file |
|---|---|---|
| Filename | modeM0/AS1A04_180T01_9000001622cztM0_level2_bc.evt | modeM0/AS1A04_180T01_9000001622cztM0_level2_quad_clean.evt |
| Size (bytes) | 1,851,019,200 | 444,029,760 |
| Size | 1.7 GB | 423.5 MB |
| Events in quadrant A | 19,915,799 | 2,690,314 |
| Events in quadrant B | 12,520,949 | 2,841,804 |
| Events in quadrant C | 7,439,042 | 2,816,123 |
| Events in quadrant D | 13,730,523 | 2,627,012 |
| Mode M0 | |||
|---|---|---|---|
| Quadrant | BADHDUFLAG | Total packets | Discarded packets |
| A | 0 | 122079 | 0 |
| B | 0 | 95134 | 0 |
| C | 0 | 75066 | 0 |
| D | 0 | 96655 | 0 |
| Mode M9 | |||
|---|---|---|---|
| Quadrant | BADHDUFLAG | Total packets | Discarded packets |
| A | 0 | 66 | 0 |
| B | 0 | 66 | 0 |
| C | 0 | 66 | 0 |
| D | 0 | 66 | 0 |
| Mode SS | |||
|---|---|---|---|
| Quadrant | BADHDUFLAG | Total packets | Discarded packets |
| A | 0 | 734 | 0 |
| B | 0 | 732 | 0 |
| C | 0 | 728 | 0 |
| D | 0 | 736 | 0 |
| Quadrant | Total seconds | Saturated seconds | Saturation percentage |
|---|---|---|---|
| A | 35851 | 3882 | 10.828150% |
| B | 35984 | 2069 | 5.749778% |
| C | 36072 | 449 | 1.244733% |
| D | 36037 | 1787 | 4.958792% |
Noise dominated data is calculated using 1-second bins in cleaned event files. If a bin has >2000 counts, and if more than 50% of those come from <1% of pixels, then it is considered to be noise-dominated and hence unusable.
| Quadrant | # 1 sec bins | Bins with >0 counts | Bins with >2000 counts | High rate bins dominated by noise | Noise dominated (total time) | Noise dominated (detector-on time) | Marked lightcurve |
|---|---|---|---|---|---|---|---|
| A | 44165 | 36164 | 468 | 468 | 1.06% | 1.29% |  |
| B | 44165 | 36283 | 61 | 61 | 0.14% | 0.17% |  |
| C | 44165 | 36387 | 11 | 11 | 0.02% | 0.03% |  |
| D | 44165 | 36363 | 414 | 414 | 0.94% | 1.14% |  |
Top three noisy pixels from each quadrant. If the there are fewer than three noisy pixels in the level2.evt file, extra rows are filled as -1
| Pixel properties | Quadrant properties | ||||||
|---|---|---|---|---|---|---|---|
| Quadrant | DetID | PixID | Counts | Sigma | Mean | Median | Sigma |
| A | 8 | 5 | 7604050 | 19503.78 | 1813 | 1778 | 389.8 |
| A | 14 | 238 | 3762299 | 9647.69 | 1813 | 1778 | 389.8 |
| A | 8 | 15 | 821299 | 2102.5 | 1813 | 1778 | 389.8 |
| B | 4 | 239 | 2316693 | 6474.98 | 1901 | 1853 | 357.5 |
| B | 10 | 16 | 1509382 | 4216.8 | 1901 | 1853 | 357.5 |
| B | 15 | 204 | 466156 | 1298.73 | 1901 | 1853 | 357.5 |
| C | 9 | 54 | 82933 | 199.05 | 1852 | 1825 | 407.5 |
| C | 9 | 204 | 74715 | 178.89 | 1852 | 1825 | 407.5 |
| C | 14 | 234 | 18282 | 40.39 | 1852 | 1825 | 407.5 |
| D | 1 | 52 | 2274697 | 5463.1 | 1807 | 1741 | 416.1 |
| D | 11 | 129 | 1372985 | 3295.81 | 1807 | 1741 | 416.1 |
| D | 10 | 253 | 1109710 | 2663.03 | 1807 | 1741 | 416.1 |
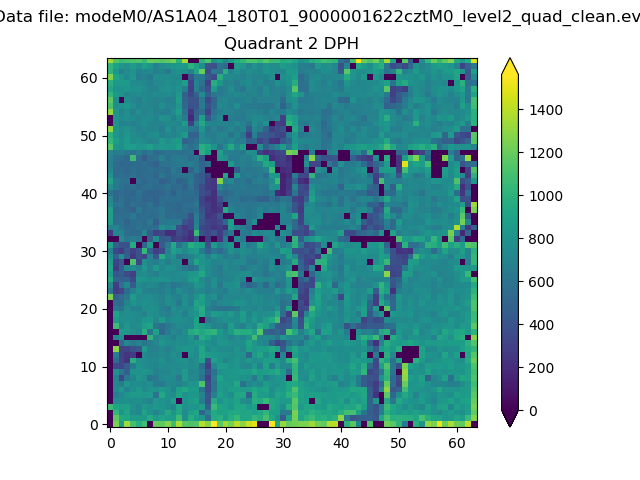
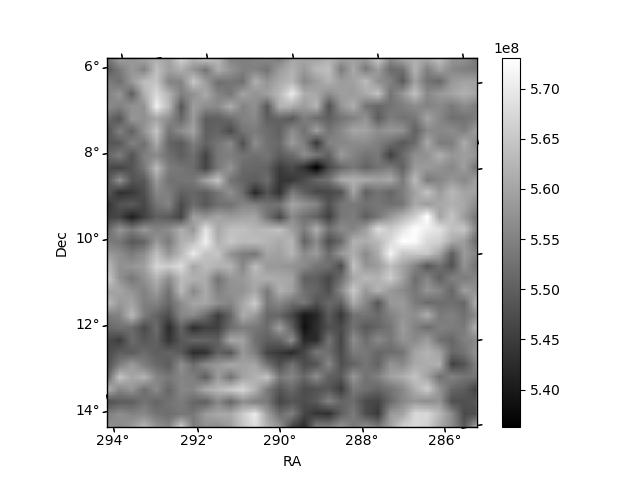
Histogram calculated using DETX and DETY for each event in the final _common_clean file
| Quadrant A | 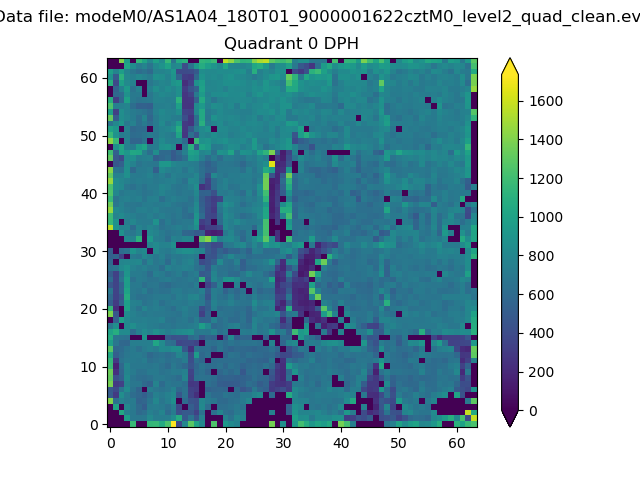 |
 |
Quadrant B |
|---|---|---|---|
| Quadrant D |  |
 |
Quadrant C |
| Plot type | Count rate plots | Images |
|---|---|---|
| Comparison with Poisson distribution Blue bars denote a histogram of data divided into 1 sec bins. Red curve is a Poisson curve with rate = median count rate of data. |
 |
 |
| Quadrant-wise count rates Data is divided into 100 sec bins |
 |
|
| Module-wise count rates for Quadrant A Data is divided into 100 sec bins |
 |
 |
| Module-wise count rates for Quadrant B Data is divided into 100 sec bins |
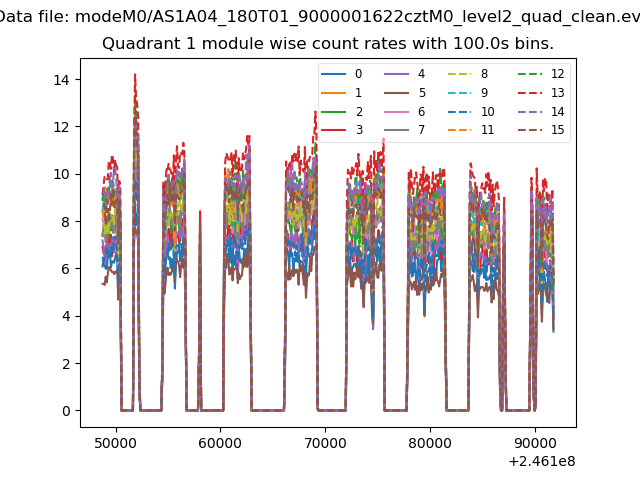 |
 |
| Module-wise count rates for Quadrant C Data is divided into 100 sec bins |
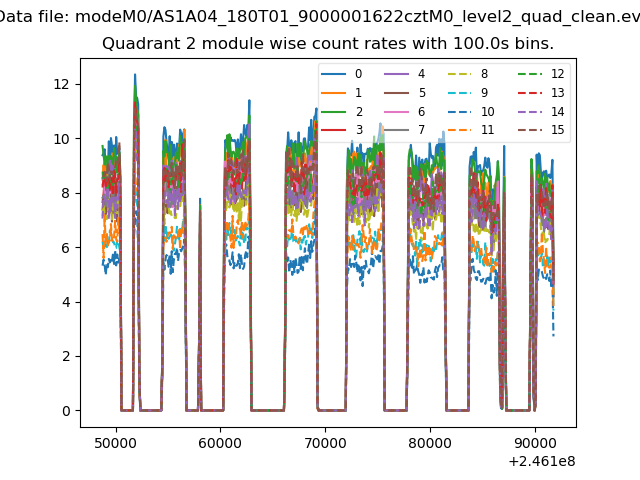 |
 |
| Module-wise count rates for Quadrant D Data is divided into 100 sec bins |
 |
 |
| Parameter | Plot |
|---|---|
| CZT HV Monitor |  |
| D_VDD |  |
| Temperature 1 |  |
| Veto HV Monitor | 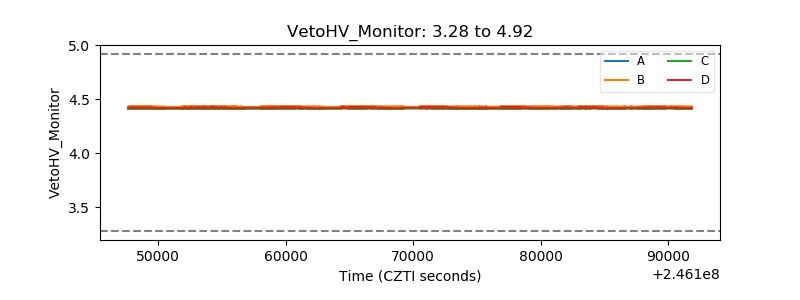 |
| Veto LLD |  |
| Alpha Counter | 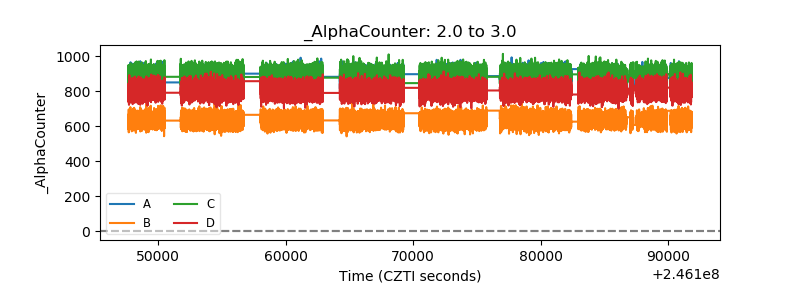 |
| _CPM_Rate |  |
| CZT Counter |  |
| +2.5 Volts monitor |  |
| +5 Volts monitor |  |
| _ROLL_ROT |  |
| _Roll_DEC | 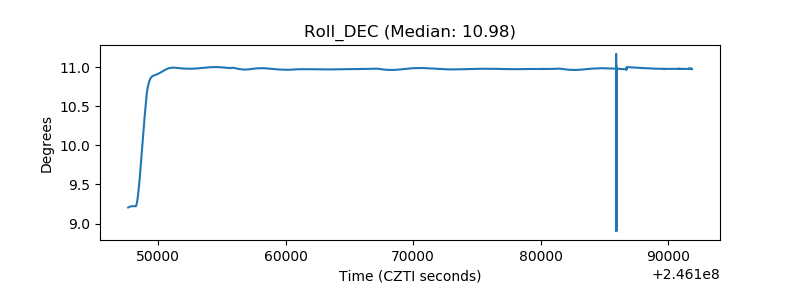 |
| _Roll_RA |  |
| Veto Counter |  |