| Param | Original file | Final file |
|---|---|---|
| Filename | modeM0/AS1G08_071T02_9000001620cztM0_level2_bc.evt | modeM0/AS1G08_071T02_9000001620cztM0_level2_quad_clean.evt |
| Size (bytes) | 12,684,925,440 | 3,196,166,400 |
| Size | 11.8 GB | 3.0 GB |
| Events in quadrant A | 94,815,328 | 19,546,968 |
| Events in quadrant B | 84,803,827 | 19,894,765 |
| Events in quadrant C | 54,642,568 | 19,979,749 |
| Events in quadrant D | 131,044,337 | 18,383,349 |
| Mode M9 | |||
|---|---|---|---|
| Quadrant | BADHDUFLAG | Total packets | Discarded packets |
| A | 0 | 420 | 0 |
| B | 0 | 420 | 0 |
| C | 0 | 420 | 0 |
| D | 0 | 420 | 0 |
| Mode SS | |||
|---|---|---|---|
| Quadrant | BADHDUFLAG | Total packets | Discarded packets |
| A | 0 | 5650 | 0 |
| B | 0 | 5650 | 0 |
| C | 0 | 5650 | 0 |
| D | 0 | 5650 | 0 |
| Mode M0 | |||
|---|---|---|---|
| Quadrant | BADHDUFLAG | Total packets | Discarded packets |
| A | 0 | 717694 | 0 |
| B | 0 | 688438 | 0 |
| C | 0 | 571142 | 0 |
| D | 0 | 831758 | 0 |
| Quadrant | Total seconds | Saturated seconds | Saturation percentage |
|---|---|---|---|
| A | 277368 | 13241 | 4.773802% |
| B | 277368 | 12496 | 4.505206% |
| C | 277368 | 2796 | 1.008047% |
| D | 277368 | 24603 | 8.870165% |
Noise dominated data is calculated using 1-second bins in cleaned event files. If a bin has >2000 counts, and if more than 50% of those come from <1% of pixels, then it is considered to be noise-dominated and hence unusable.
| Quadrant | # 1 sec bins | Bins with >0 counts | Bins with >2000 counts | High rate bins dominated by noise | Noise dominated (total time) | Noise dominated (detector-on time) | Marked lightcurve |
|---|---|---|---|---|---|---|---|
| A | 319675 | 277374 | 1586 | 1586 | 0.50% | 0.57% |  |
| B | 319675 | 277367 | 478 | 478 | 0.15% | 0.17% | 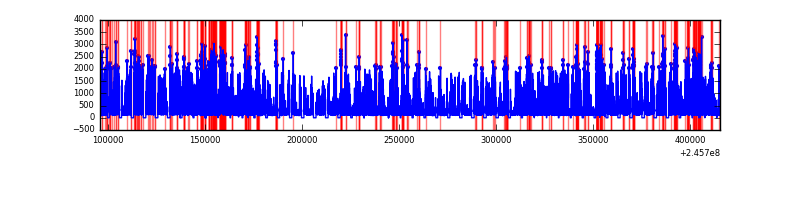 |
| C | 319675 | 277379 | 41 | 41 | 0.01% | 0.01% |  |
| D | 319675 | 277337 | 7677 | 7677 | 2.40% | 2.77% |  |
Top three noisy pixels from each quadrant. If the there are fewer than three noisy pixels in the level2.evt file, extra rows are filled as -1
| Pixel properties | Quadrant properties | ||||||
|---|---|---|---|---|---|---|---|
| Quadrant | DetID | PixID | Counts | Sigma | Mean | Median | Sigma |
| A | 8 | 5 | 32034398 | 10880.92 | 13726 | 13469 | 2942.9 |
| A | 8 | 15 | 6620565 | 2245.13 | 13726 | 13469 | 2942.9 |
| A | 14 | 238 | 1189260 | 399.54 | 13726 | 13469 | 2942.9 |
| B | 4 | 239 | 16670519 | 6272.99 | 13996 | 13582 | 2655.3 |
| B | 10 | 16 | 7345077 | 2761.04 | 13996 | 13582 | 2655.3 |
| B | 15 | 204 | 2198581 | 822.87 | 13996 | 13582 | 2655.3 |
| C | 9 | 54 | 459428 | 148.48 | 13736 | 13543 | 3003.1 |
| C | 14 | 234 | 142819 | 43.05 | 13736 | 13543 | 3003.1 |
| C | 9 | 204 | 115047 | 33.8 | 13736 | 13543 | 3003.1 |
| D | 10 | 253 | 29909552 | 9834.54 | 13148 | 12671 | 3040.0 |
| D | 1 | 52 | 22634213 | 7441.32 | 13148 | 12671 | 3040.0 |
| D | 8 | 195 | 4500469 | 1476.25 | 13148 | 12671 | 3040.0 |
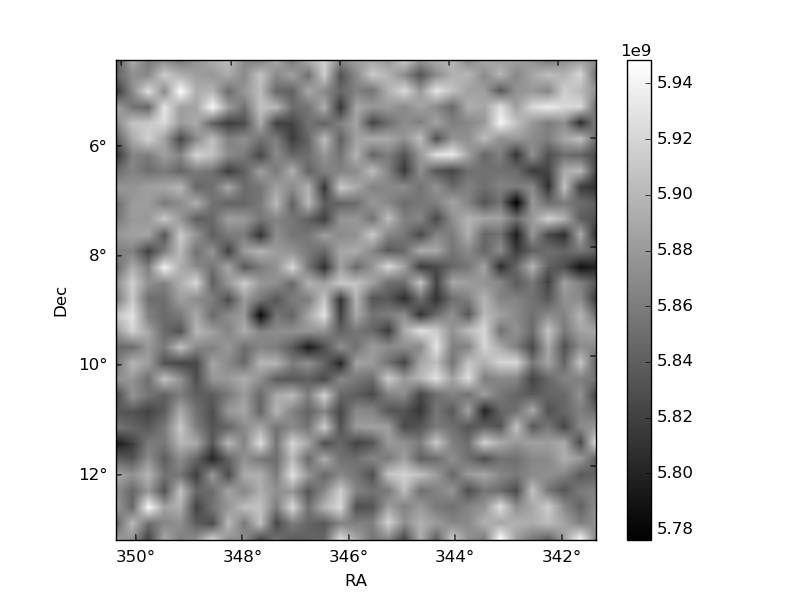
Histogram calculated using DETX and DETY for each event in the final _common_clean file
| Quadrant A | 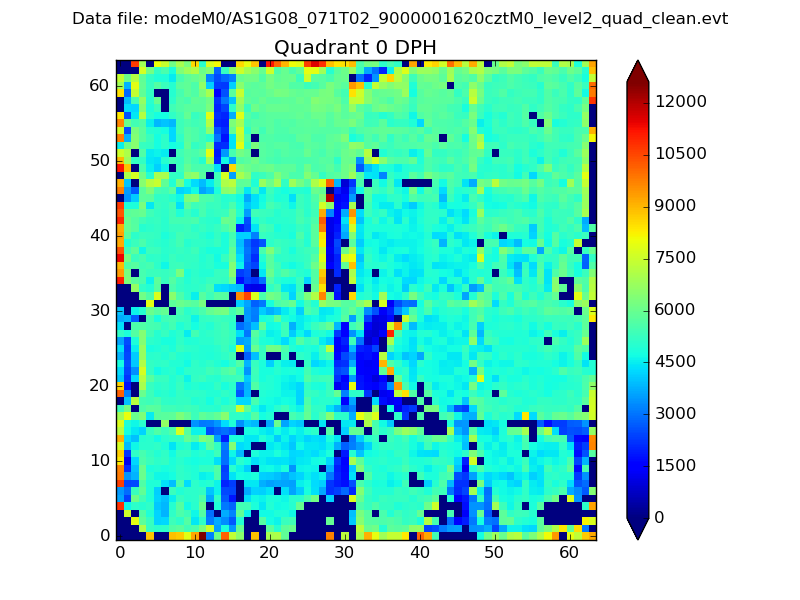 |
 |
Quadrant B |
|---|---|---|---|
| Quadrant D |  |
 |
Quadrant C |
| Plot type | Count rate plots | Images |
|---|---|---|
| Comparison with Poisson distribution Blue bars denote a histogram of data divided into 1 sec bins. Red curve is a Poisson curve with rate = median count rate of data. |
 |
 |
| Quadrant-wise count rates Data is divided into 100 sec bins |
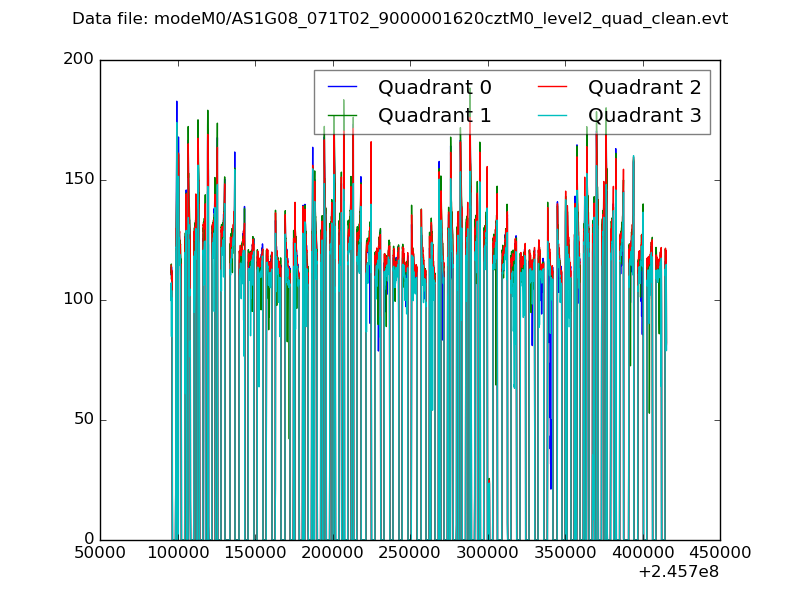 |
|
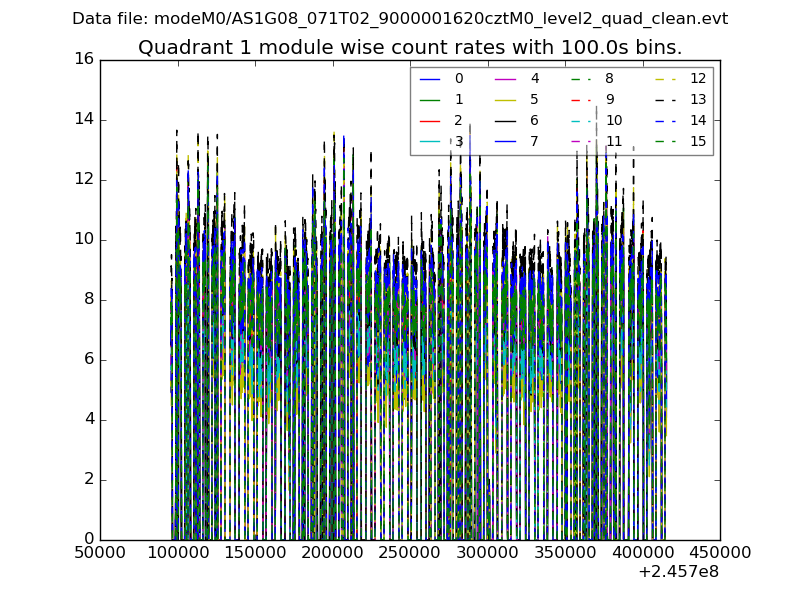
| Module-wise count rates for Quadrant A Data is divided into 100 sec bins |
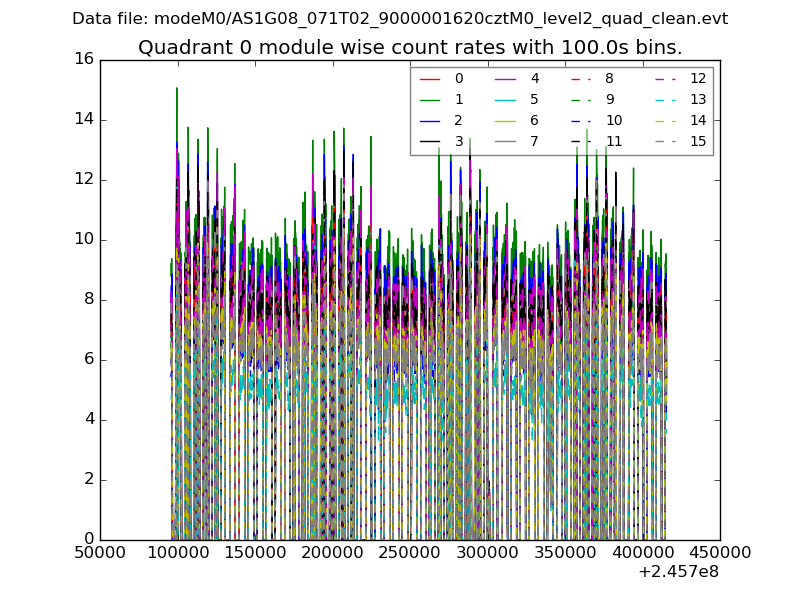 |
 |
| Module-wise count rates for Quadrant B Data is divided into 100 sec bins |
 |
 |
| Module-wise count rates for Quadrant C Data is divided into 100 sec bins |
 |
 |
| Module-wise count rates for Quadrant D Data is divided into 100 sec bins |
 |
 |
| Parameter | Plot |
|---|---|
| CZT HV Monitor |  |
| D_VDD | 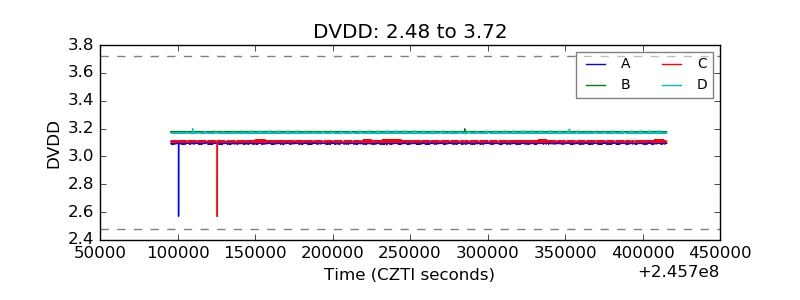 |
| Temperature 1 |  |
| Veto HV Monitor |  |
| Veto LLD |  |
| Alpha Counter |  |
| _CPM_Rate |  |
| CZT Counter | 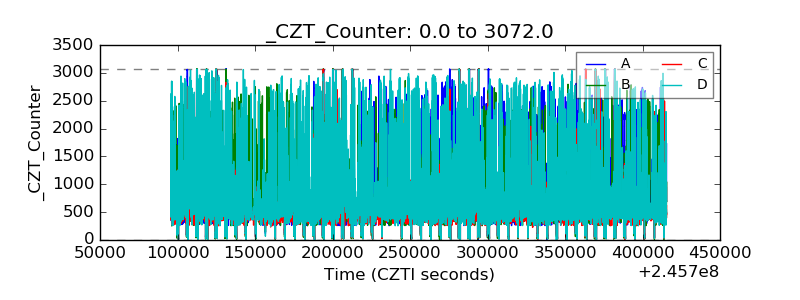 |
| +2.5 Volts monitor |  |
| +5 Volts monitor |  |
| _ROLL_ROT | 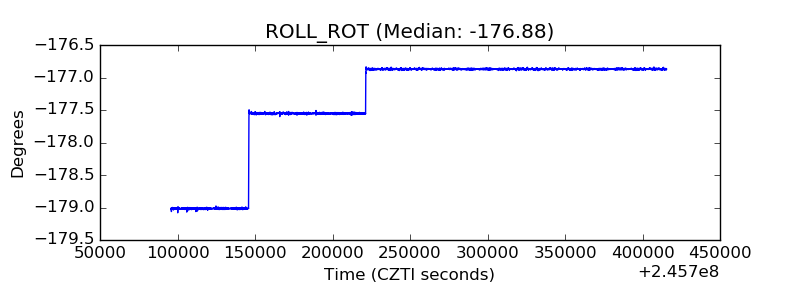 |
| _Roll_DEC | 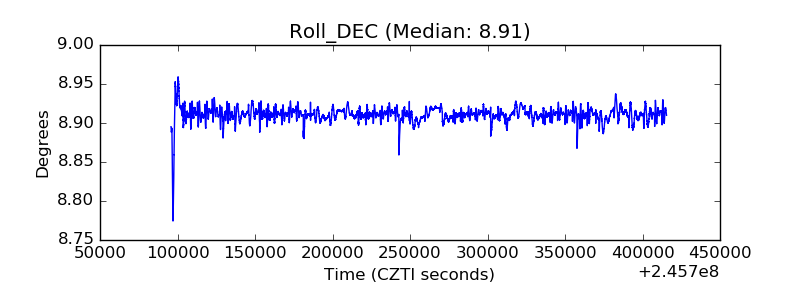 |
| _Roll_RA |  |
| Veto Counter |  |