| Param | Original file | Final file |
|---|---|---|
| Filename | modeM0/AS1G08_075T01_9000001616cztM0_level2.evt | modeM0/AS1G08_075T01_9000001616cztM0_level2_quad_clean.evt |
| Size (bytes) | 3,112,971,840 | 505,134,720 |
| Size | 2.9 GB | 481.7 MB |
| Events in quadrant A | 22,163,878 | 3,231,152 |
| Events in quadrant B | 25,863,321 | 3,215,552 |
| Events in quadrant C | 17,935,988 | 3,220,322 |
| Events in quadrant D | 25,730,348 | 2,998,769 |
| Mode M0 | |||
|---|---|---|---|
| Quadrant | BADHDUFLAG | Total packets | Discarded packets |
| A | 0 | 90235 | 0 |
| B | 0 | 101597 | 0 |
| C | 0 | 79033 | 0 |
| D | 0 | 101943 | 0 |
| Mode SS | |||
|---|---|---|---|
| Quadrant | BADHDUFLAG | Total packets | Discarded packets |
| A | 0 | 784 | 0 |
| B | 0 | 784 | 0 |
| C | 0 | 784 | 0 |
| D | 0 | 784 | 0 |
| Mode M9 | |||
|---|---|---|---|
| Quadrant | BADHDUFLAG | Total packets | Discarded packets |
| A | 0 | 89 | 0 |
| B | 0 | 89 | 0 |
| C | 0 | 89 | 0 |
| D | 0 | 89 | 0 |
| Quadrant | Total seconds | Saturated seconds | Saturation percentage |
|---|---|---|---|
| A | 38350 | 614 | 1.601043% |
| B | 38350 | 2106 | 5.491525% |
| C | 38350 | 325 | 0.847458% |
| D | 38350 | 1684 | 4.391134% |
Noise dominated data is calculated using 1-second bins in cleaned event files. If a bin has >2000 counts, and if more than 50% of those come from <1% of pixels, then it is considered to be noise-dominated and hence unusable.
| Quadrant | # 1 sec bins | Bins with >0 counts | Bins with >2000 counts | High rate bins dominated by noise | Noise dominated (total time) | Noise dominated (detector-on time) | Marked lightcurve |
|---|---|---|---|---|---|---|---|
| A | 47260 | 38357 | 31 | 31 | 0.07% | 0.08% |  |
| B | 47260 | 38355 | 981 | 981 | 2.08% | 2.56% |  |
| C | 47260 | 38358 | 5 | 5 | 0.01% | 0.01% |  |
| D | 47260 | 38357 | 1209 | 1209 | 2.56% | 3.15% |  |
Top three noisy pixels from each quadrant. If the there are fewer than three noisy pixels in the level2.evt file, extra rows are filled as -1
| Pixel properties | Quadrant properties | ||||||
|---|---|---|---|---|---|---|---|
| Quadrant | DetID | PixID | Counts | Sigma | Mean | Median | Sigma |
| A | 15 | 174 | 2021451 | 2126.96 | 4756 | 4655 | 948.2 |
| A | 8 | 15 | 1779736 | 1872.04 | 4756 | 4655 | 948.2 |
| A | 0 | 226 | 42765 | 40.19 | 4756 | 4655 | 948.2 |
| B | 4 | 239 | 6930515 | 7849.65 | 4693 | 4586 | 882.3 |
| B | 0 | 214 | 240503 | 267.38 | 4693 | 4586 | 882.3 |
| B | 15 | 204 | 206750 | 229.13 | 4693 | 4586 | 882.3 |
| C | 14 | 234 | 42599 | 36.27 | 4590 | 4627 | 1047.0 |
| C | 13 | 61 | 34000 | 28.06 | 4590 | 4627 | 1047.0 |
| C | 8 | 222 | 12214 | 7.25 | 4590 | 4627 | 1047.0 |
| D | 10 | 253 | 4030740 | 3753.59 | 4507 | 4387 | 1072.7 |
| D | 11 | 129 | 2265767 | 2108.18 | 4507 | 4387 | 1072.7 |
| D | 1 | 52 | 789680 | 732.09 | 4507 | 4387 | 1072.7 |
Histogram calculated using DETX and DETY for each event in the final _common_clean file
| Quadrant A |  |
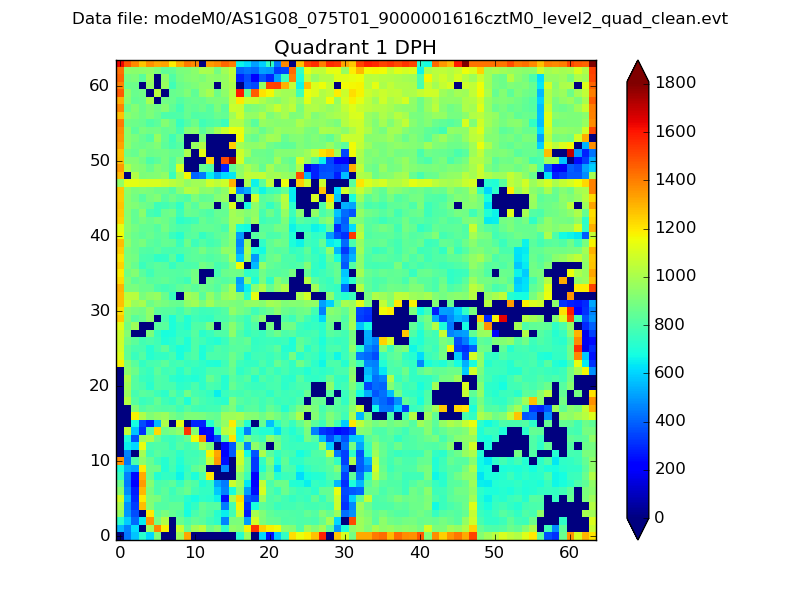 |
Quadrant B |
|---|---|---|---|
| Quadrant D |  |
 |
Quadrant C |
| Plot type | Count rate plots | Images |
|---|---|---|
| Comparison with Poisson distribution Blue bars denote a histogram of data divided into 1 sec bins. Red curve is a Poisson curve with rate = median count rate of data. |
 |
 |
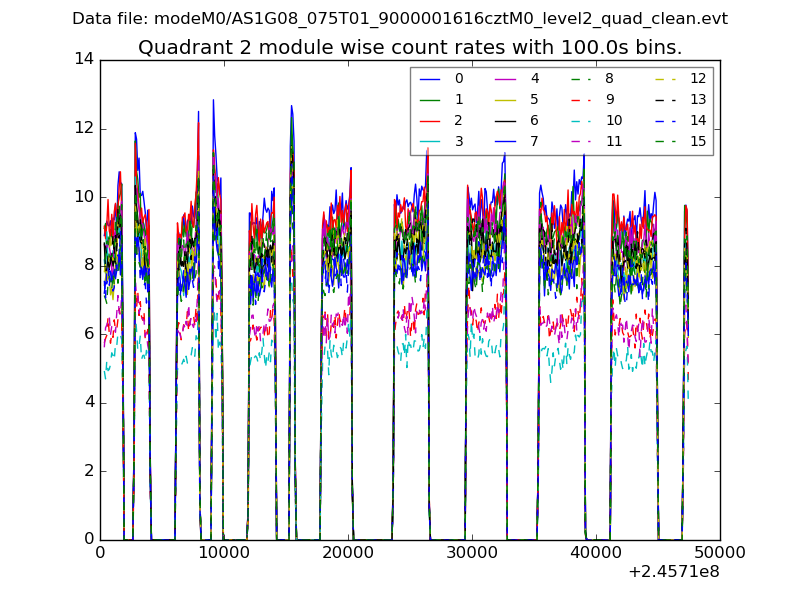
| Quadrant-wise count rates Data is divided into 100 sec bins |
 |
|
| Module-wise count rates for Quadrant A Data is divided into 100 sec bins |
 |
 |
| Module-wise count rates for Quadrant B Data is divided into 100 sec bins |
 |
 |
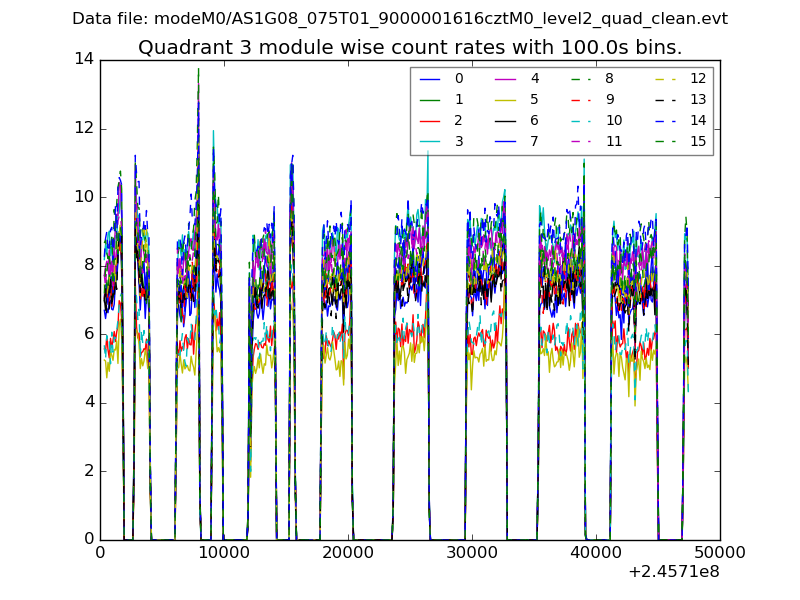
| Module-wise count rates for Quadrant C Data is divided into 100 sec bins |
 |
 |
| Module-wise count rates for Quadrant D Data is divided into 100 sec bins |
 |
 |
| Parameter | Plot |
|---|---|
| CZT HV Monitor | 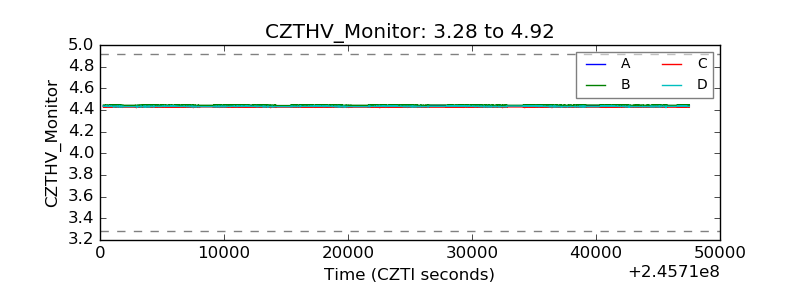 |
| D_VDD | 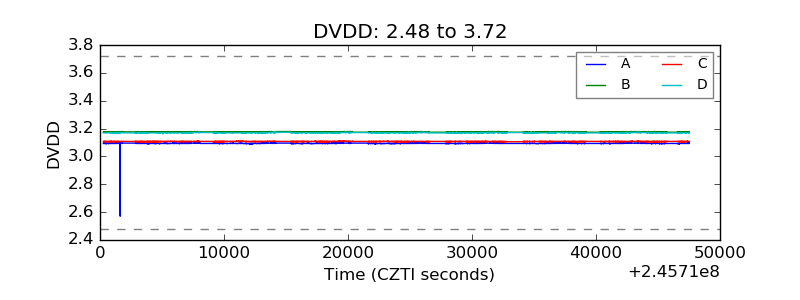 |
| Temperature 1 |  |
| Veto HV Monitor |  |
| Veto LLD |  |
| Alpha Counter | 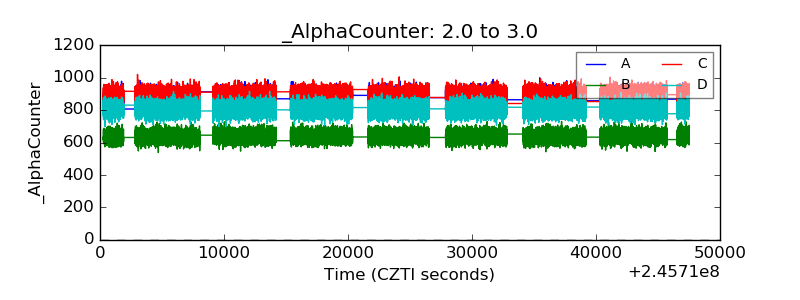 |
| _CPM_Rate | 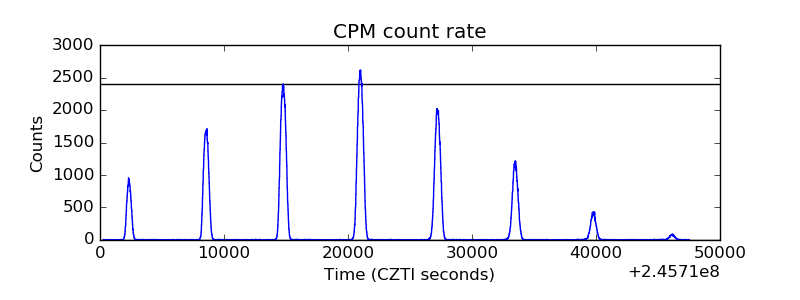 |
| CZT Counter |  |
| +2.5 Volts monitor |  |
| +5 Volts monitor | 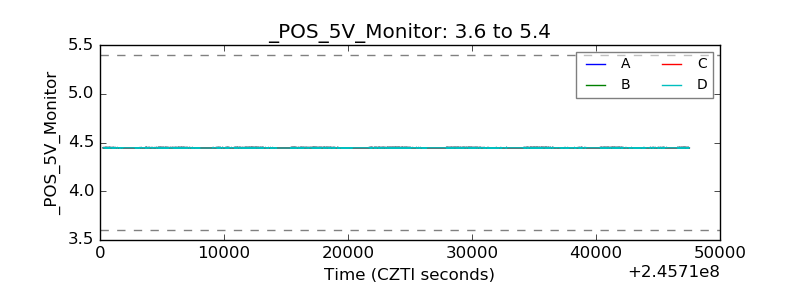 |
| _ROLL_ROT |  |
| _Roll_DEC | 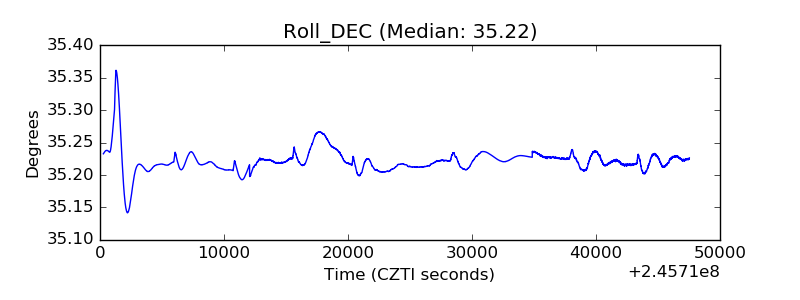 |
| _Roll_RA |  |
| Veto Counter |  |