| Param | Original file | Final file |
|---|---|---|
| Filename | modeM0/AS1A04_053T04_9000001614cztM0_level2.evt | modeM0/AS1A04_053T04_9000001614cztM0_level2_quad_clean.evt |
| Size (bytes) | 466,093,440 | 83,093,760 |
| Size | 444.5 MB | 79.2 MB |
| Events in quadrant A | 3,372,632 | 520,682 |
| Events in quadrant B | 3,914,416 | 516,268 |
| Events in quadrant C | 2,923,813 | 509,241 |
| Events in quadrant D | 3,438,567 | 491,909 |
| Mode SS | |||
|---|---|---|---|
| Quadrant | BADHDUFLAG | Total packets | Discarded packets |
| A | 0 | 138 | 0 |
| B | 0 | 138 | 0 |
| C | 0 | 138 | 0 |
| D | 0 | 138 | 0 |
| Mode M9 | |||
|---|---|---|---|
| Quadrant | BADHDUFLAG | Total packets | Discarded packets |
| A | 0 | 8 | 0 |
| B | 0 | 8 | 0 |
| C | 0 | 8 | 0 |
| D | 0 | 8 | 0 |
| Mode M0 | |||
|---|---|---|---|
| Quadrant | BADHDUFLAG | Total packets | Discarded packets |
| A | 0 | 15296 | 0 |
| B | 0 | 16440 | 0 |
| C | 0 | 13871 | 0 |
| D | 0 | 15211 | 0 |
| Quadrant | Total seconds | Saturated seconds | Saturation percentage |
|---|---|---|---|
| A | 6864 | 29 | 0.422494% |
| B | 6865 | 191 | 2.782229% |
| C | 6863 | 7 | 0.101996% |
| D | 6865 | 49 | 0.713765% |
Noise dominated data is calculated using 1-second bins in cleaned event files. If a bin has >2000 counts, and if more than 50% of those come from <1% of pixels, then it is considered to be noise-dominated and hence unusable.
| Quadrant | # 1 sec bins | Bins with >0 counts | Bins with >2000 counts | High rate bins dominated by noise | Noise dominated (total time) | Noise dominated (detector-on time) | Marked lightcurve |
|---|---|---|---|---|---|---|---|
| A | 7606 | 6867 | 0 | 0 | 0.00% | 0.00% | 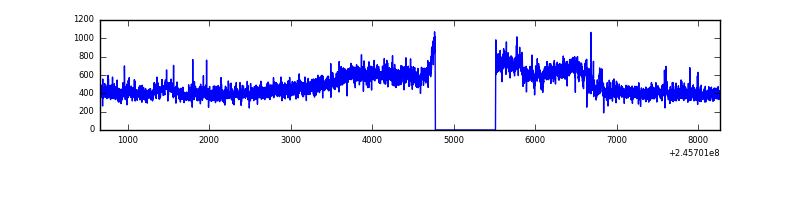 |
| B | 7606 | 6866 | 80 | 80 | 1.05% | 1.17% |  |
| C | 7606 | 6867 | 0 | 0 | 0.00% | 0.00% |  |
| D | 7606 | 6867 | 37 | 37 | 0.49% | 0.54% |  |
Top three noisy pixels from each quadrant. If the there are fewer than three noisy pixels in the level2.evt file, extra rows are filled as -1
| Pixel properties | Quadrant properties | ||||||
|---|---|---|---|---|---|---|---|
| Quadrant | DetID | PixID | Counts | Sigma | Mean | Median | Sigma |
| A | 15 | 174 | 413459 | 2625.64 | 766 | 751 | 157.2 |
| A | 11 | 29 | 9758 | 57.3 | 766 | 751 | 157.2 |
| A | 0 | 226 | 6861 | 38.87 | 766 | 751 | 157.2 |
| B | 4 | 239 | 818843 | 5548.22 | 766 | 745 | 147.5 |
| B | 0 | 214 | 42683 | 284.42 | 766 | 745 | 147.5 |
| B | 3 | 189 | 29061 | 192.03 | 766 | 745 | 147.5 |
| C | 8 | 128 | 8260 | 43.2 | 746 | 748 | 173.9 |
| C | 13 | 61 | 5557 | 27.65 | 746 | 748 | 173.9 |
| C | 8 | 112 | 4658 | 22.48 | 746 | 748 | 173.9 |
| D | 11 | 129 | 203560 | 1147.4 | 736 | 717 | 176.8 |
| D | 1 | 52 | 138289 | 778.19 | 736 | 717 | 176.8 |
| D | 10 | 253 | 115781 | 650.87 | 736 | 717 | 176.8 |
Histogram calculated using DETX and DETY for each event in the final _common_clean file
| Quadrant A | 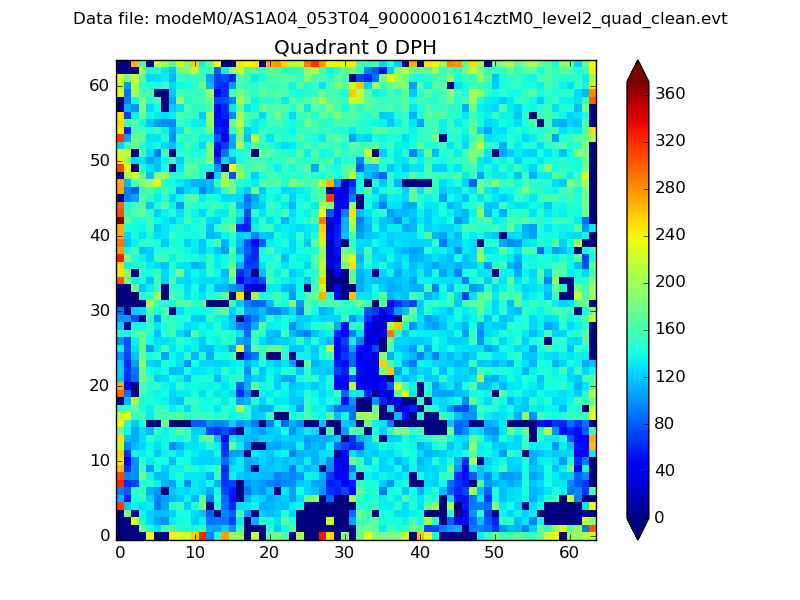 |
 |
Quadrant B |
|---|---|---|---|
| Quadrant D |  |
 |
Quadrant C |
| Plot type | Count rate plots | Images |
|---|---|---|
| Comparison with Poisson distribution Blue bars denote a histogram of data divided into 1 sec bins. Red curve is a Poisson curve with rate = median count rate of data. |
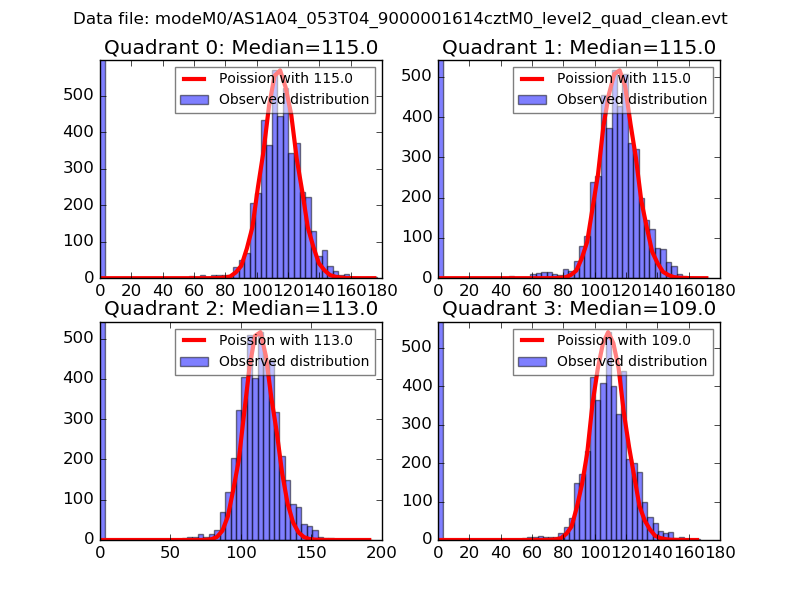 |
 |
| Quadrant-wise count rates Data is divided into 100 sec bins |
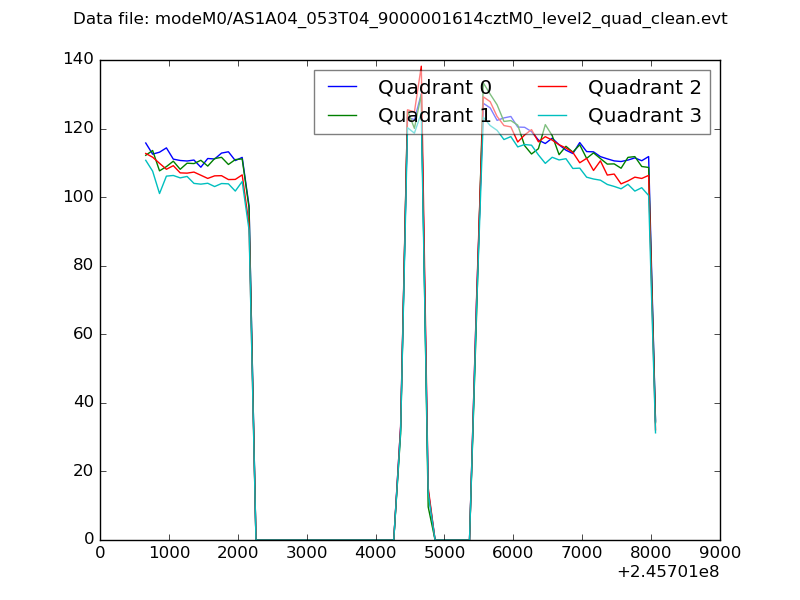 |
|
| Module-wise count rates for Quadrant A Data is divided into 100 sec bins |
 |
 |
| Module-wise count rates for Quadrant B Data is divided into 100 sec bins |
 |
 |
| Module-wise count rates for Quadrant C Data is divided into 100 sec bins |
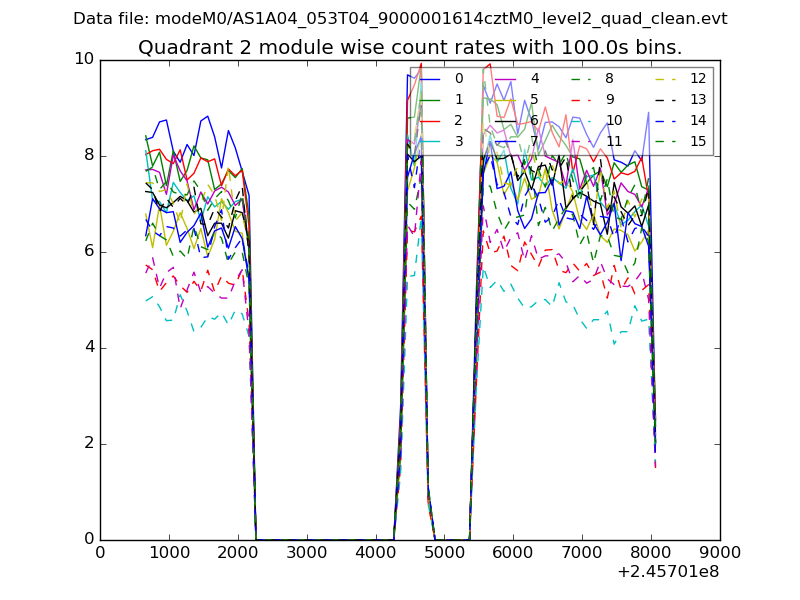 |
 |
| Module-wise count rates for Quadrant D Data is divided into 100 sec bins |
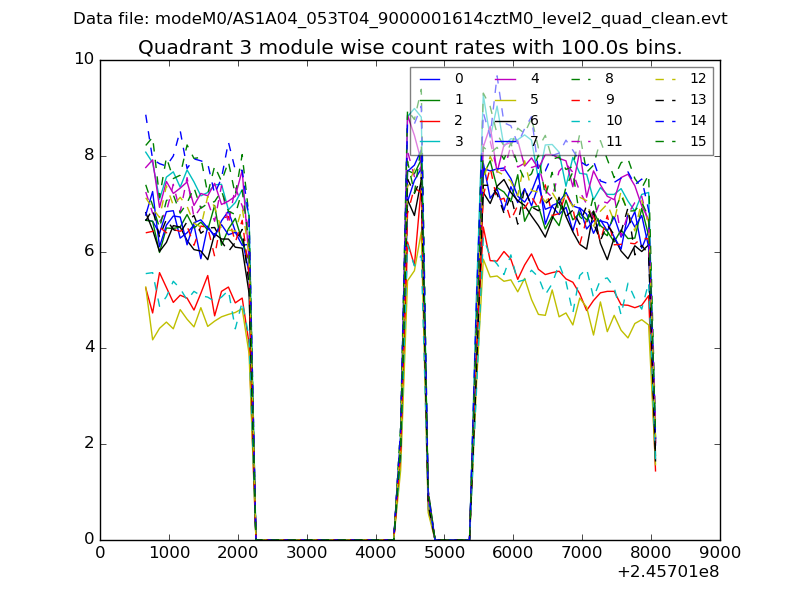 |
 |
| Parameter | Plot |
|---|---|
| CZT HV Monitor | 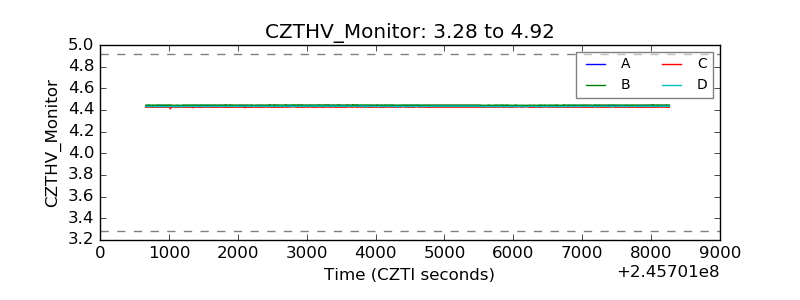 |
| D_VDD |  |
| Temperature 1 |  |
| Veto HV Monitor |  |
| Veto LLD |  |
| Alpha Counter |  |
| _CPM_Rate |  |
| CZT Counter |  |
| +2.5 Volts monitor | 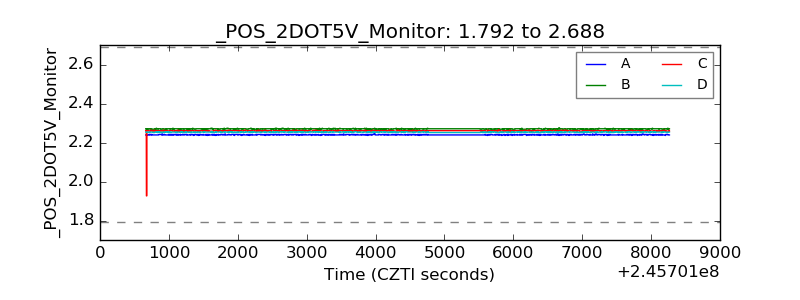 |
| +5 Volts monitor |  |
| _ROLL_ROT |  |
| _Roll_DEC |  |
| _Roll_RA |  |
| Veto Counter |  |