| Param | Original file | Final file |
|---|---|---|
| Filename | modeM0/AS1A04_053T01_9000001610cztM0_level2.evt | modeM0/AS1A04_053T01_9000001610cztM0_level2_quad_clean.evt |
| Size (bytes) | 621,256,320 | 108,722,880 |
| Size | 592.5 MB | 103.7 MB |
| Events in quadrant A | 3,763,656 | 691,060 |
| Events in quadrant B | 5,779,678 | 675,046 |
| Events in quadrant C | 3,689,752 | 682,402 |
| Events in quadrant D | 5,008,347 | 656,931 |
| Mode M9 | |||
|---|---|---|---|
| Quadrant | BADHDUFLAG | Total packets | Discarded packets |
| A | 0 | 1 | 0 |
| B | 0 | 1 | 0 |
| C | 0 | 1 | 0 |
| D | 0 | 1 | 0 |
| Mode SS | |||
|---|---|---|---|
| Quadrant | BADHDUFLAG | Total packets | Discarded packets |
| A | 0 | 170 | 0 |
| B | 0 | 170 | 0 |
| C | 0 | 170 | 0 |
| D | 0 | 170 | 0 |
| Mode M0 | |||
|---|---|---|---|
| Quadrant | BADHDUFLAG | Total packets | Discarded packets |
| A | 0 | 17443 | 0 |
| B | 0 | 22852 | 0 |
| C | 0 | 17396 | 0 |
| D | 0 | 20843 | 0 |
| Quadrant | Total seconds | Saturated seconds | Saturation percentage |
|---|---|---|---|
| A | 8457 | 111 | 1.312522% |
| B | 8457 | 514 | 6.077805% |
| C | 8457 | 42 | 0.496630% |
| D | 8457 | 155 | 1.832801% |
Noise dominated data is calculated using 1-second bins in cleaned event files. If a bin has >2000 counts, and if more than 50% of those come from <1% of pixels, then it is considered to be noise-dominated and hence unusable.
| Quadrant | # 1 sec bins | Bins with >0 counts | Bins with >2000 counts | High rate bins dominated by noise | Noise dominated (total time) | Noise dominated (detector-on time) | Marked lightcurve |
|---|---|---|---|---|---|---|---|
| A | 8472 | 8458 | 1 | 1 | 0.01% | 0.01% |  |
| B | 8472 | 8458 | 288 | 288 | 3.40% | 3.41% |  |
| C | 8472 | 8458 | 1 | 1 | 0.01% | 0.01% |  |
| D | 8472 | 8458 | 84 | 84 | 0.99% | 0.99% |  |
Top three noisy pixels from each quadrant. If the there are fewer than three noisy pixels in the level2.evt file, extra rows are filled as -1
| Pixel properties | Quadrant properties | ||||||
|---|---|---|---|---|---|---|---|
| Quadrant | DetID | PixID | Counts | Sigma | Mean | Median | Sigma |
| A | 14 | 238 | 13070 | 61.03 | 968 | 944 | 198.7 |
| A | 14 | 254 | 11852 | 54.9 | 968 | 944 | 198.7 |
| A | 13 | 248 | 11472 | 52.99 | 968 | 944 | 198.7 |
| B | 4 | 239 | 1702492 | 9268.57 | 961 | 936 | 183.6 |
| B | 3 | 189 | 97032 | 523.45 | 961 | 936 | 183.6 |
| B | 15 | 204 | 84403 | 454.65 | 961 | 936 | 183.6 |
| C | 14 | 234 | 9083 | 37.06 | 940 | 946 | 219.6 |
| C | 8 | 128 | 8130 | 32.72 | 940 | 946 | 219.6 |
| C | 13 | 61 | 7123 | 28.13 | 940 | 946 | 219.6 |
| D | 11 | 129 | 494305 | 2219.28 | 925 | 898 | 222.3 |
| D | 1 | 52 | 419636 | 1883.43 | 925 | 898 | 222.3 |
| D | 8 | 195 | 184848 | 827.38 | 925 | 898 | 222.3 |
Histogram calculated using DETX and DETY for each event in the final _common_clean file
| Quadrant A |  |
 |
Quadrant B |
|---|---|---|---|
| Quadrant D |  |
 |
Quadrant C |
| Plot type | Count rate plots | Images |
|---|---|---|
| Comparison with Poisson distribution Blue bars denote a histogram of data divided into 1 sec bins. Red curve is a Poisson curve with rate = median count rate of data. |
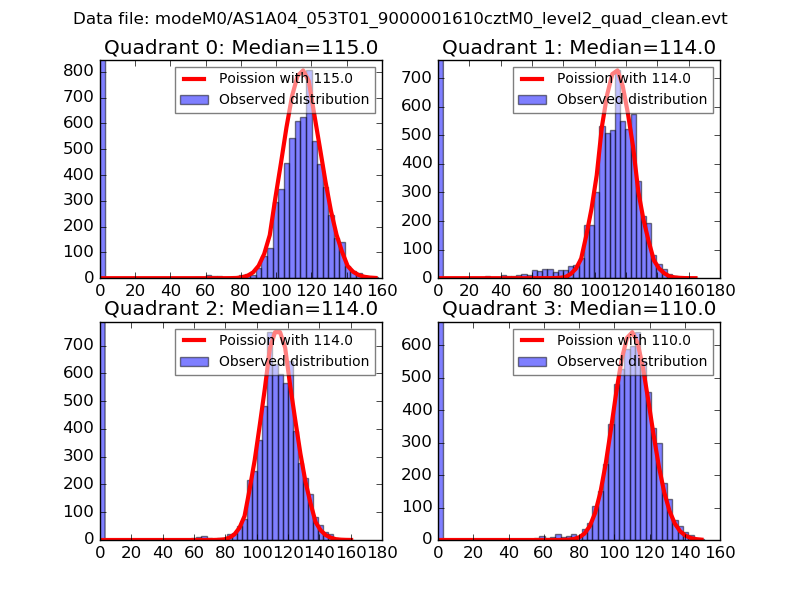 |
 |
| Quadrant-wise count rates Data is divided into 100 sec bins |
 |
|
| Module-wise count rates for Quadrant A Data is divided into 100 sec bins |
 |
 |
| Module-wise count rates for Quadrant B Data is divided into 100 sec bins |
 |
 |
| Module-wise count rates for Quadrant C Data is divided into 100 sec bins |
 |
 |
| Module-wise count rates for Quadrant D Data is divided into 100 sec bins |
 |
 |
| Parameter | Plot |
|---|---|
| CZT HV Monitor | 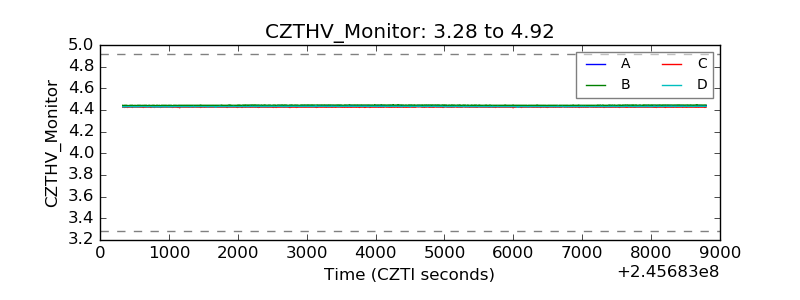 |
| D_VDD | 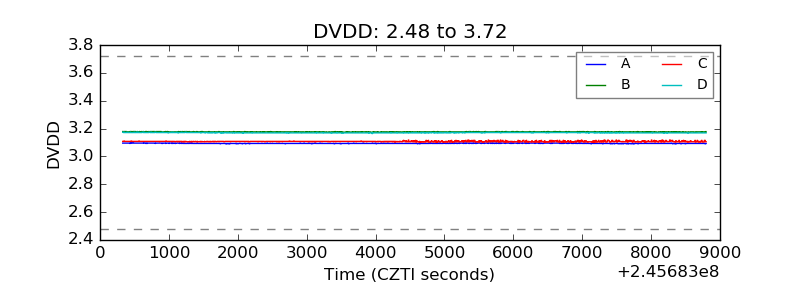 |
| Temperature 1 | 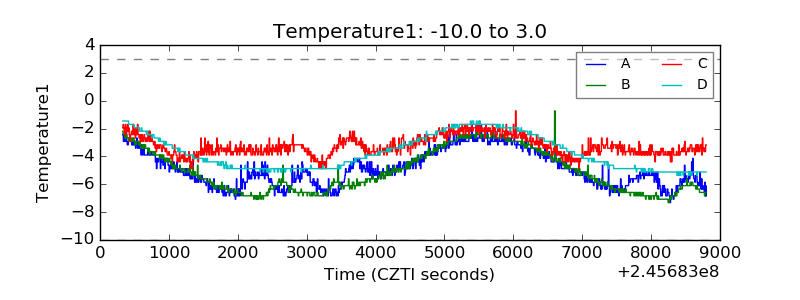 |
| Veto HV Monitor |  |
| Veto LLD |  |
| Alpha Counter |  |
| _CPM_Rate |  |
| CZT Counter |  |
| +2.5 Volts monitor |  |
| +5 Volts monitor |  |
| _ROLL_ROT | 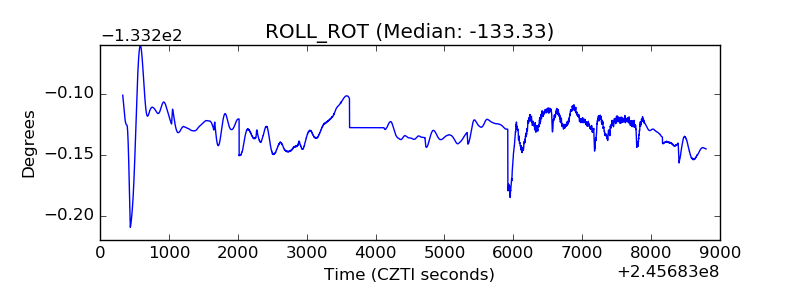 |
| _Roll_DEC |  |
| _Roll_RA |  |
| Veto Counter | 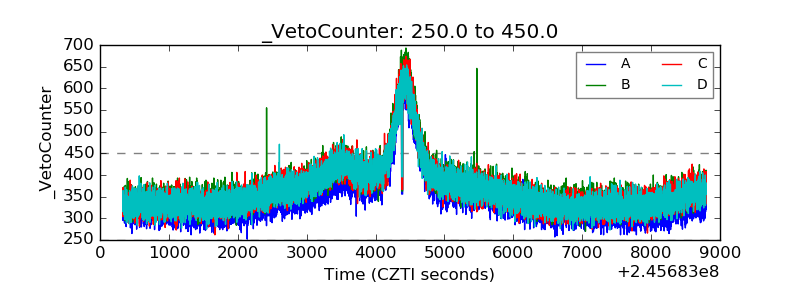 |