| Param | Original file | Final file |
|---|---|---|
| Filename | modeM0/AS1C03_006T01_9000001608cztM0_level2.evt | modeM0/AS1C03_006T01_9000001608cztM0_level2_quad_clean.evt |
| Size (bytes) | 6,123,646,080 | 809,372,160 |
| Size | 5.7 GB | 771.9 MB |
| Events in quadrant A | 60,422,710 | 4,844,980 |
| Events in quadrant B | 45,569,711 | 5,065,088 |
| Events in quadrant C | 31,806,104 | 5,108,161 |
| Events in quadrant D | 43,073,510 | 4,819,003 |
| Mode SS | |||
|---|---|---|---|
| Quadrant | BADHDUFLAG | Total packets | Discarded packets |
| A | 0 | 1388 | 0 |
| B | 0 | 1388 | 0 |
| C | 0 | 1388 | 0 |
| D | 0 | 1388 | 0 |
| Mode M0 | |||
|---|---|---|---|
| Quadrant | BADHDUFLAG | Total packets | Discarded packets |
| A | 0 | 225319 | 0 |
| B | 0 | 179712 | 0 |
| C | 0 | 140768 | 0 |
| D | 0 | 172783 | 0 |
| Mode M9 | |||
|---|---|---|---|
| Quadrant | BADHDUFLAG | Total packets | Discarded packets |
| A | 0 | 108 | 0 |
| B | 0 | 108 | 0 |
| C | 0 | 108 | 0 |
| D | 0 | 108 | 0 |
| Quadrant | Total seconds | Saturated seconds | Saturation percentage |
|---|---|---|---|
| A | 68164 | 8055 | 11.817088% |
| B | 68164 | 3592 | 5.269644% |
| C | 68164 | 512 | 0.751130% |
| D | 68164 | 1644 | 2.411830% |
Noise dominated data is calculated using 1-second bins in cleaned event files. If a bin has >2000 counts, and if more than 50% of those come from <1% of pixels, then it is considered to be noise-dominated and hence unusable.
| Quadrant | # 1 sec bins | Bins with >0 counts | Bins with >2000 counts | High rate bins dominated by noise | Noise dominated (total time) | Noise dominated (detector-on time) | Marked lightcurve |
|---|---|---|---|---|---|---|---|
| A | 79064 | 68172 | 5411 | 5411 | 6.84% | 7.94% |  |
| B | 79064 | 68175 | 1646 | 1646 | 2.08% | 2.41% |  |
| C | 79064 | 68176 | 20 | 20 | 0.03% | 0.03% |  |
| D | 79064 | 68175 | 929 | 929 | 1.17% | 1.36% | 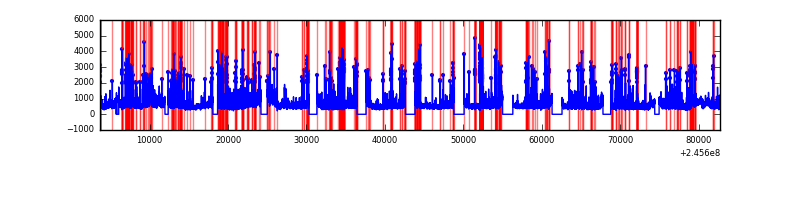 |
Top three noisy pixels from each quadrant. If the there are fewer than three noisy pixels in the level2.evt file, extra rows are filled as -1
| Pixel properties | Quadrant properties | ||||||
|---|---|---|---|---|---|---|---|
| Quadrant | DetID | PixID | Counts | Sigma | Mean | Median | Sigma |
| A | 14 | 238 | 20782900 | 12790.73 | 8046 | 7877 | 1624.2 |
| A | 15 | 174 | 5473966 | 3365.35 | 8046 | 7877 | 1624.2 |
| A | 13 | 210 | 3080967 | 1892.03 | 8046 | 7877 | 1624.2 |
| B | 4 | 239 | 11913777 | 7637.44 | 8281 | 8093 | 1558.9 |
| B | 0 | 214 | 308279 | 192.57 | 8281 | 8093 | 1558.9 |
| B | 15 | 204 | 274484 | 170.89 | 8281 | 8093 | 1558.9 |
| C | 9 | 54 | 114157 | 56.83 | 8112 | 8164 | 1864.9 |
| C | 13 | 61 | 60469 | 28.05 | 8112 | 8164 | 1864.9 |
| C | 8 | 222 | 40144 | 17.15 | 8112 | 8164 | 1864.9 |
| D | 1 | 52 | 3987204 | 2061.64 | 8032 | 7819 | 1930.2 |
| D | 11 | 129 | 1981112 | 1022.32 | 8032 | 7819 | 1930.2 |
| D | 8 | 195 | 1878621 | 969.22 | 8032 | 7819 | 1930.2 |
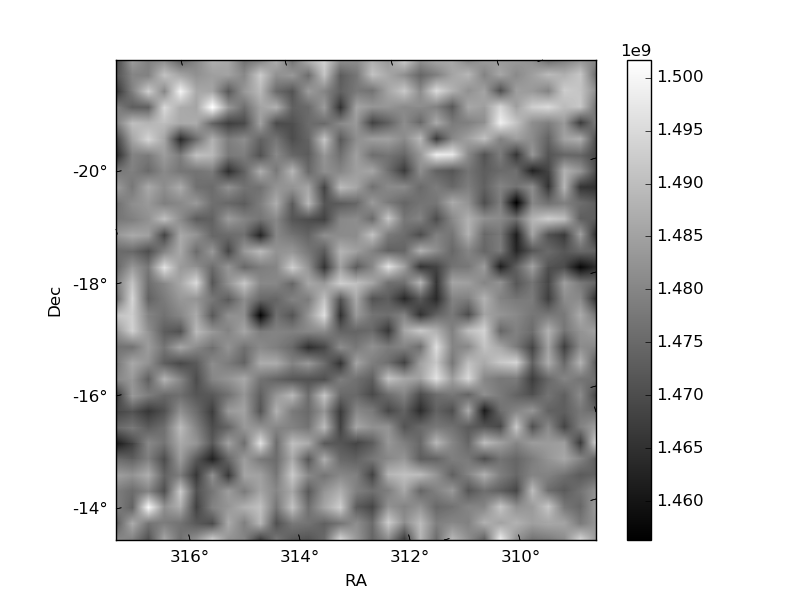
Histogram calculated using DETX and DETY for each event in the final _common_clean file
| Quadrant A |  |
 |
Quadrant B |
|---|---|---|---|
| Quadrant D | 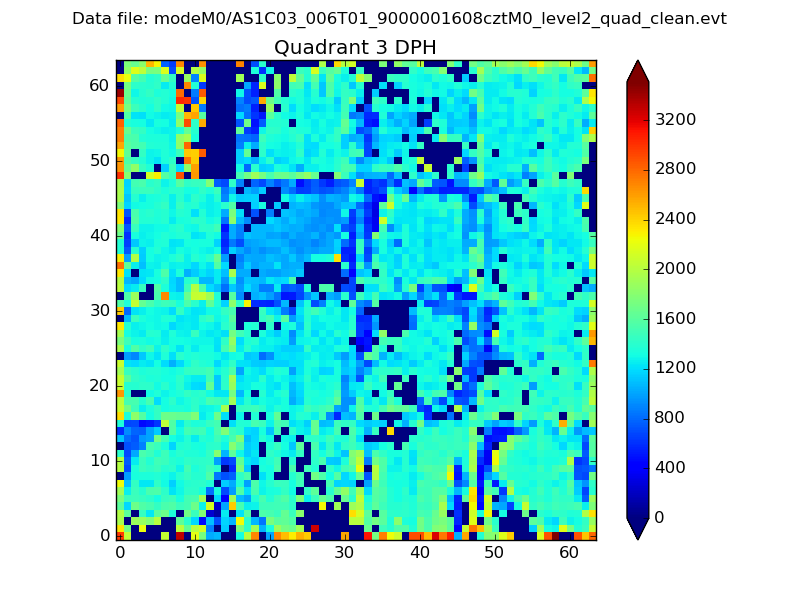 |
 |
Quadrant C |
| Plot type | Count rate plots | Images |
|---|---|---|
| Comparison with Poisson distribution Blue bars denote a histogram of data divided into 1 sec bins. Red curve is a Poisson curve with rate = median count rate of data. |
 |
 |
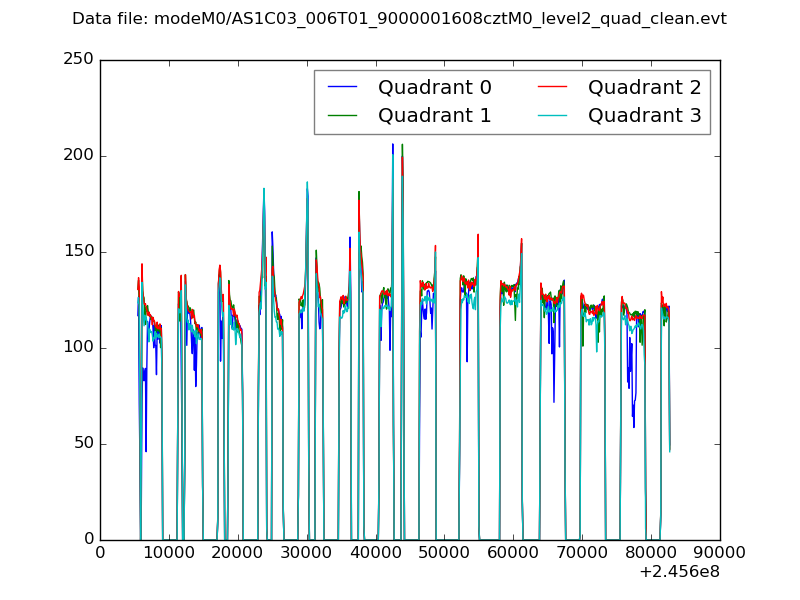
| Quadrant-wise count rates Data is divided into 100 sec bins |
 |
|
| Module-wise count rates for Quadrant A Data is divided into 100 sec bins |
 |
 |
| Module-wise count rates for Quadrant B Data is divided into 100 sec bins |
 |
 |
| Module-wise count rates for Quadrant C Data is divided into 100 sec bins |
 |
 |
| Module-wise count rates for Quadrant D Data is divided into 100 sec bins |
 |
 |
| Parameter | Plot |
|---|---|
| CZT HV Monitor |  |
| D_VDD | 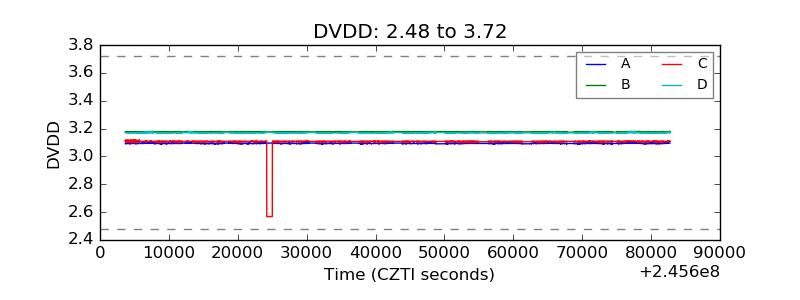 |
| Temperature 1 |  |
| Veto HV Monitor |  |
| Veto LLD |  |
| Alpha Counter | 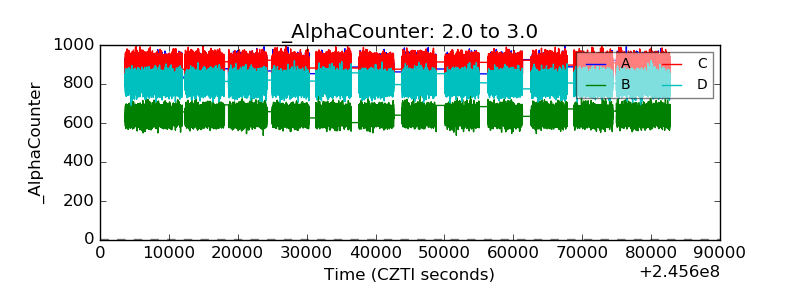 |
| _CPM_Rate |  |
| CZT Counter |  |
| +2.5 Volts monitor | 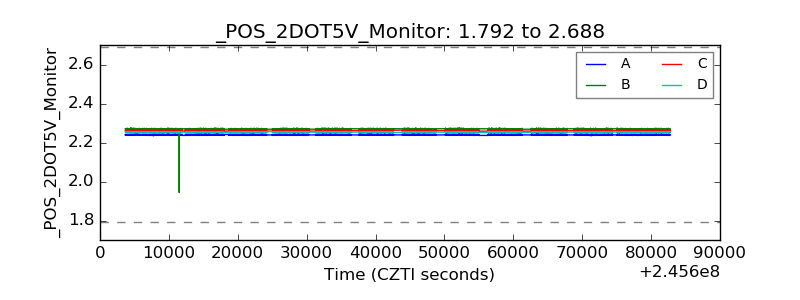 |
| +5 Volts monitor |  |
| _ROLL_ROT | 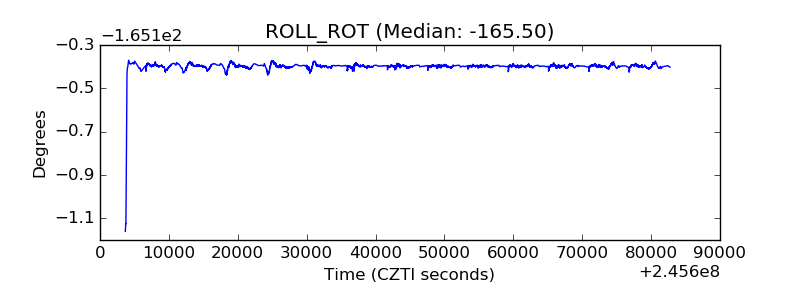 |
| _Roll_DEC |  |
| _Roll_RA |  |
| Veto Counter |  |