| Param | Original file | Final file |
|---|---|---|
| Filename | modeM0/AS1A04_130T03_9000001602cztM0_level2.evt | modeM0/AS1A04_130T03_9000001602cztM0_level2_quad_clean.evt |
| Size (bytes) | 1,651,743,360 | 241,548,480 |
| Size | 1.5 GB | 230.4 MB |
| Events in quadrant A | 16,222,867 | 1,482,609 |
| Events in quadrant B | 12,723,984 | 1,532,595 |
| Events in quadrant C | 8,304,754 | 1,571,124 |
| Events in quadrant D | 11,560,113 | 1,489,486 |
| Mode M0 | |||
|---|---|---|---|
| Quadrant | BADHDUFLAG | Total packets | Discarded packets |
| A | 0 | 60253 | 0 |
| B | 0 | 49354 | 0 |
| C | 0 | 37257 | 0 |
| D | 0 | 45978 | 0 |
| Mode SS | |||
|---|---|---|---|
| Quadrant | BADHDUFLAG | Total packets | Discarded packets |
| A | 0 | 370 | 0 |
| B | 0 | 370 | 0 |
| C | 0 | 372 | 0 |
| D | 0 | 370 | 0 |
| Mode M9 | |||
|---|---|---|---|
| Quadrant | BADHDUFLAG | Total packets | Discarded packets |
| A | 0 | 26 | 0 |
| B | 0 | 26 | 0 |
| C | 0 | 26 | 0 |
| D | 0 | 26 | 0 |
| Quadrant | Total seconds | Saturated seconds | Saturation percentage |
|---|---|---|---|
| A | 17859 | 1954 | 10.941262% |
| B | 17954 | 1392 | 7.753147% |
| C | 18005 | 312 | 1.732852% |
| D | 18006 | 896 | 4.976119% |
Noise dominated data is calculated using 1-second bins in cleaned event files. If a bin has >2000 counts, and if more than 50% of those come from <1% of pixels, then it is considered to be noise-dominated and hence unusable.
| Quadrant | # 1 sec bins | Bins with >0 counts | Bins with >2000 counts | High rate bins dominated by noise | Noise dominated (total time) | Noise dominated (detector-on time) | Marked lightcurve |
|---|---|---|---|---|---|---|---|
| A | 20962 | 18108 | 1247 | 1247 | 5.95% | 6.89% |  |
| B | 20962 | 18159 | 730 | 730 | 3.48% | 4.02% |  |
| C | 20962 | 18191 | 12 | 12 | 0.06% | 0.07% |  |
| D | 20962 | 18190 | 522 | 522 | 2.49% | 2.87% |  |
Top three noisy pixels from each quadrant. If the there are fewer than three noisy pixels in the level2.evt file, extra rows are filled as -1
| Pixel properties | Quadrant properties | ||||||
|---|---|---|---|---|---|---|---|
| Quadrant | DetID | PixID | Counts | Sigma | Mean | Median | Sigma |
| A | 14 | 238 | 4949826 | 11553.41 | 2121 | 2077 | 428.3 |
| A | 15 | 174 | 2149502 | 5014.42 | 2121 | 2077 | 428.3 |
| A | 8 | 5 | 912094 | 2124.97 | 2121 | 2077 | 428.3 |
| B | 4 | 239 | 3967142 | 9682.97 | 2149 | 2095 | 409.5 |
| B | 3 | 189 | 111459 | 267.08 | 2149 | 2095 | 409.5 |
| B | 4 | 81 | 74811 | 177.58 | 2149 | 2095 | 409.5 |
| C | 14 | 234 | 36838 | 70.76 | 2118 | 2132 | 490.4 |
| C | 13 | 61 | 15811 | 27.89 | 2118 | 2132 | 490.4 |
| C | 12 | 4 | 9995 | 16.03 | 2118 | 2132 | 490.4 |
| D | 2 | 14 | 857193 | 1704.59 | 2095 | 2037 | 501.7 |
| D | 11 | 129 | 666380 | 1324.24 | 2095 | 2037 | 501.7 |
| D | 1 | 52 | 654511 | 1300.58 | 2095 | 2037 | 501.7 |
Histogram calculated using DETX and DETY for each event in the final _common_clean file
| Quadrant A | 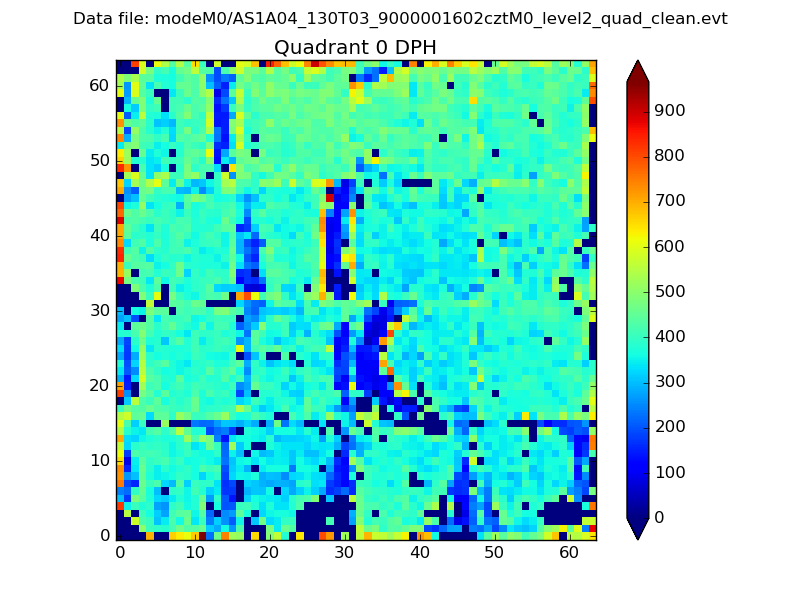 |
 |
Quadrant B |
|---|---|---|---|
| Quadrant D |  |
 |
Quadrant C |
| Plot type | Count rate plots | Images |
|---|---|---|
| Comparison with Poisson distribution Blue bars denote a histogram of data divided into 1 sec bins. Red curve is a Poisson curve with rate = median count rate of data. |
 |
 |
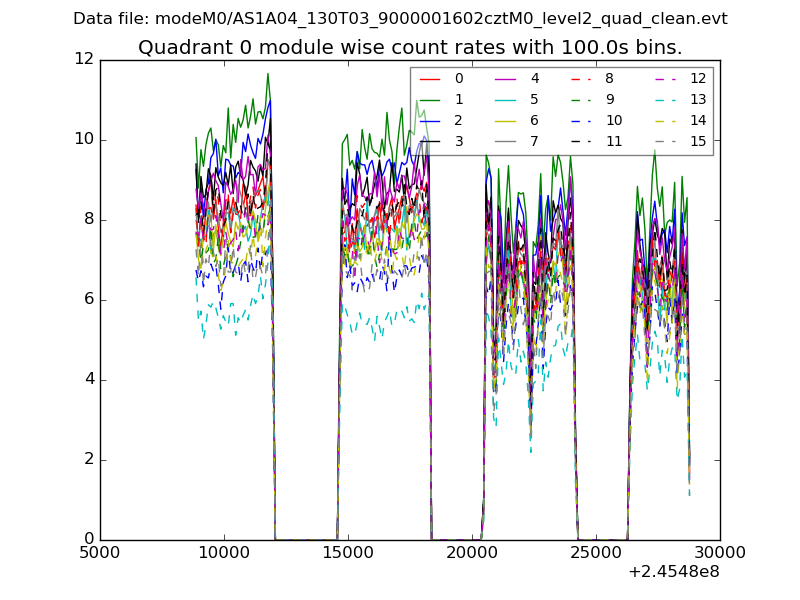
| Quadrant-wise count rates Data is divided into 100 sec bins |
 |
|
| Module-wise count rates for Quadrant A Data is divided into 100 sec bins |
 |
 |
| Module-wise count rates for Quadrant B Data is divided into 100 sec bins |
 |
 |
| Module-wise count rates for Quadrant C Data is divided into 100 sec bins |
 |
 |
| Module-wise count rates for Quadrant D Data is divided into 100 sec bins |
 |
 |
| Parameter | Plot |
|---|---|
| CZT HV Monitor |  |
| D_VDD |  |
| Temperature 1 | 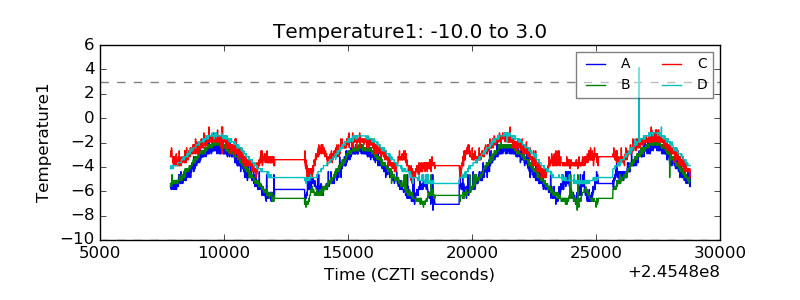 |
| Veto HV Monitor |  |
| Veto LLD |  |
| Alpha Counter |  |
| _CPM_Rate |  |
| CZT Counter | 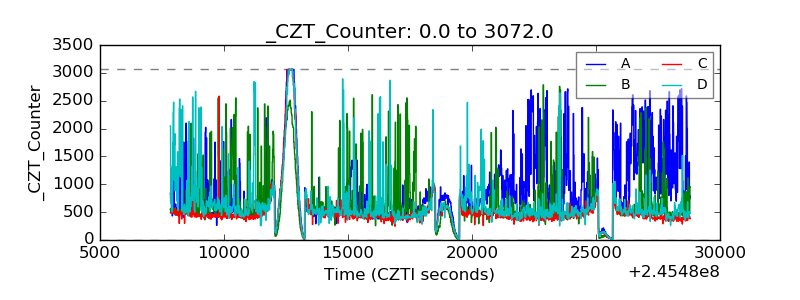 |
| +2.5 Volts monitor | 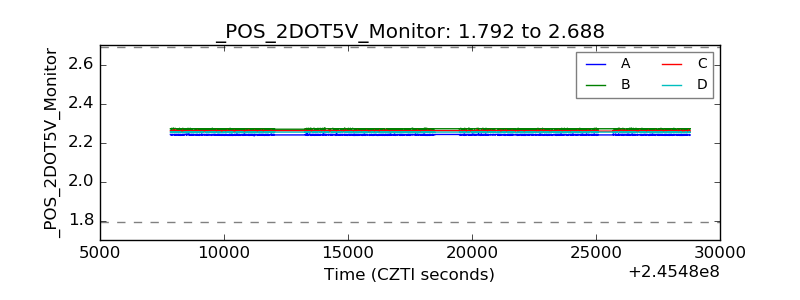 |
| +5 Volts monitor | 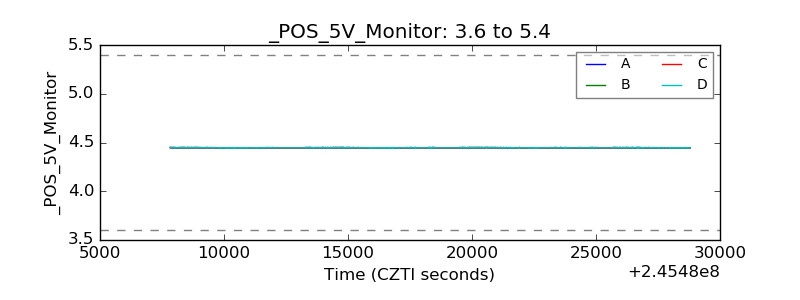 |
| _ROLL_ROT |  |
| _Roll_DEC | 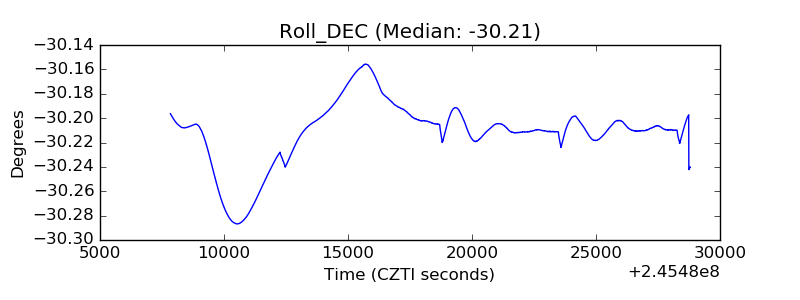 |
| _Roll_RA |  |
| Veto Counter |  |