| Param | Original file | Final file |
|---|---|---|
| Filename | modeM0/AS1A04_113T02_9000001606cztM0_level2.evt | modeM0/AS1A04_113T02_9000001606cztM0_level2_quad_clean.evt |
| Size (bytes) | 5,217,845,760 | 599,952,960 |
| Size | 4.9 GB | 572.2 MB |
| Events in quadrant A | 66,778,007 | 3,318,148 |
| Events in quadrant B | 32,569,135 | 3,828,804 |
| Events in quadrant C | 23,215,210 | 3,910,509 |
| Events in quadrant D | 32,120,756 | 3,696,781 |
| Mode M0 | |||
|---|---|---|---|
| Quadrant | BADHDUFLAG | Total packets | Discarded packets |
| A | 0 | 232871 | 0 |
| B | 0 | 128912 | 0 |
| C | 0 | 102797 | 0 |
| D | 0 | 127338 | 0 |
| Mode M9 | |||
|---|---|---|---|
| Quadrant | BADHDUFLAG | Total packets | Discarded packets |
| A | 0 | 83 | 0 |
| B | 0 | 83 | 0 |
| C | 0 | 83 | 0 |
| D | 0 | 83 | 0 |
| Mode SS | |||
|---|---|---|---|
| Quadrant | BADHDUFLAG | Total packets | Discarded packets |
| A | 0 | 1014 | 0 |
| B | 0 | 1014 | 0 |
| C | 0 | 1014 | 0 |
| D | 0 | 1014 | 0 |
| Quadrant | Total seconds | Saturated seconds | Saturation percentage |
|---|---|---|---|
| A | 49735 | 14097 | 28.344224% |
| B | 49737 | 2867 | 5.764320% |
| C | 49738 | 517 | 1.039447% |
| D | 49738 | 1561 | 3.138445% |
Noise dominated data is calculated using 1-second bins in cleaned event files. If a bin has >2000 counts, and if more than 50% of those come from <1% of pixels, then it is considered to be noise-dominated and hence unusable.
| Quadrant | # 1 sec bins | Bins with >0 counts | Bins with >2000 counts | High rate bins dominated by noise | Noise dominated (total time) | Noise dominated (detector-on time) | Marked lightcurve |
|---|---|---|---|---|---|---|---|
| A | 58114 | 49750 | 10854 | 10854 | 18.68% | 21.82% |  |
| B | 58115 | 49756 | 1367 | 1367 | 2.35% | 2.75% |  |
| C | 58115 | 49758 | 0 | 0 | 0.00% | 0.00% |  |
| D | 58115 | 49757 | 913 | 913 | 1.57% | 1.83% |  |
Top three noisy pixels from each quadrant. If the there are fewer than three noisy pixels in the level2.evt file, extra rows are filled as -1
| Pixel properties | Quadrant properties | ||||||
|---|---|---|---|---|---|---|---|
| Quadrant | DetID | PixID | Counts | Sigma | Mean | Median | Sigma |
| A | 14 | 238 | 24572020 | 22703.11 | 5384 | 5269 | 1082.1 |
| A | 8 | 5 | 15262602 | 14099.9 | 5384 | 5269 | 1082.1 |
| A | 15 | 174 | 6088241 | 5621.51 | 5384 | 5269 | 1082.1 |
| B | 4 | 239 | 8303229 | 7431.49 | 5985 | 5845 | 1116.5 |
| B | 4 | 81 | 262318 | 229.71 | 5985 | 5845 | 1116.5 |
| B | 0 | 214 | 169066 | 146.19 | 5985 | 5845 | 1116.5 |
| C | 13 | 61 | 43456 | 27.77 | 5933 | 5972 | 1349.8 |
| C | 9 | 54 | 32337 | 19.53 | 5933 | 5972 | 1349.8 |
| C | 8 | 128 | 23846 | 13.24 | 5933 | 5972 | 1349.8 |
| D | 8 | 195 | 2321887 | 1666.33 | 5854 | 5701 | 1390.0 |
| D | 11 | 129 | 1828475 | 1311.35 | 5854 | 5701 | 1390.0 |
| D | 14 | 34 | 1744252 | 1250.76 | 5854 | 5701 | 1390.0 |
Histogram calculated using DETX and DETY for each event in the final _common_clean file
| Quadrant A | 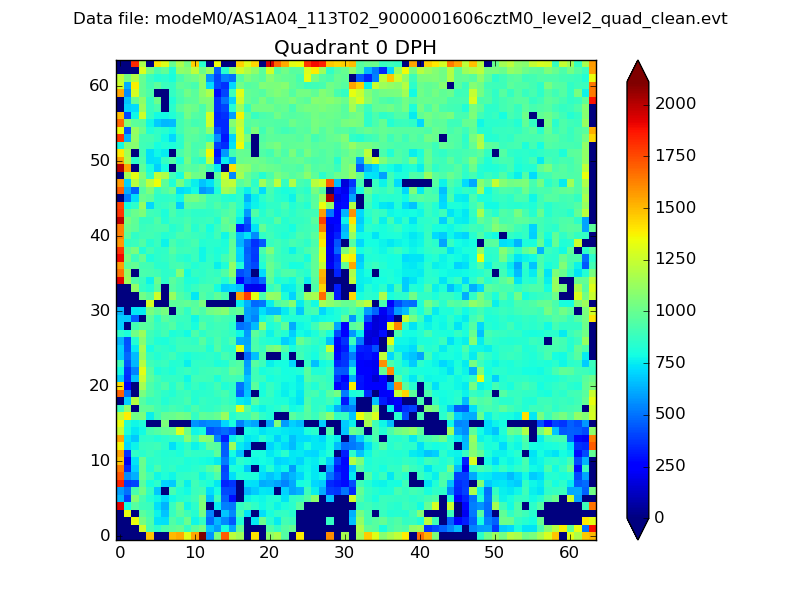 |
 |
Quadrant B |
|---|---|---|---|
| Quadrant D |  |
 |
Quadrant C |
| Plot type | Count rate plots | Images |
|---|---|---|
| Comparison with Poisson distribution Blue bars denote a histogram of data divided into 1 sec bins. Red curve is a Poisson curve with rate = median count rate of data. |
 |
 |
| Quadrant-wise count rates Data is divided into 100 sec bins |
 |
|
| Module-wise count rates for Quadrant A Data is divided into 100 sec bins |
 |
 |
| Module-wise count rates for Quadrant B Data is divided into 100 sec bins |
 |
 |
| Module-wise count rates for Quadrant C Data is divided into 100 sec bins |
 |
 |
| Module-wise count rates for Quadrant D Data is divided into 100 sec bins |
 |
 |
| Parameter | Plot |
|---|---|
| CZT HV Monitor |  |
| D_VDD |  |
| Temperature 1 |  |
| Veto HV Monitor |  |
| Veto LLD |  |
| Alpha Counter |  |
| _CPM_Rate |  |
| CZT Counter |  |
| +2.5 Volts monitor |  |
| +5 Volts monitor |  |
| _ROLL_ROT |  |
| _Roll_DEC |  |
| _Roll_RA |  |
| Veto Counter |  |