| Param | Original file | Final file |
|---|---|---|
| Filename | modeM0/AS1G08_046T09_9000001600cztM0_level2.evt | modeM0/AS1G08_046T09_9000001600cztM0_level2_quad_clean.evt |
| Size (bytes) | 6,479,426,880 | 920,903,040 |
| Size | 6.0 GB | 878.2 MB |
| Events in quadrant A | 61,829,907 | 5,520,060 |
| Events in quadrant B | 48,558,940 | 5,919,046 |
| Events in quadrant C | 32,250,297 | 5,972,230 |
| Events in quadrant D | 48,837,858 | 5,630,379 |
| Mode SS | |||
|---|---|---|---|
| Quadrant | BADHDUFLAG | Total packets | Discarded packets |
| A | 0 | 1440 | 0 |
| B | 0 | 1442 | 0 |
| C | 0 | 1440 | 0 |
| D | 0 | 1436 | 0 |
| Mode M9 | |||
|---|---|---|---|
| Quadrant | BADHDUFLAG | Total packets | Discarded packets |
| A | 0 | 118 | 0 |
| B | 0 | 118 | 0 |
| C | 0 | 118 | 0 |
| D | 0 | 118 | 0 |
| Mode M0 | |||
|---|---|---|---|
| Quadrant | BADHDUFLAG | Total packets | Discarded packets |
| A | 0 | 231498 | 0 |
| B | 0 | 191697 | 0 |
| C | 0 | 145884 | 0 |
| D | 0 | 192658 | 0 |
| Quadrant | Total seconds | Saturated seconds | Saturation percentage |
|---|---|---|---|
| A | 70599 | 8631 | 12.225386% |
| B | 70690 | 4633 | 6.553968% |
| C | 70780 | 452 | 0.638598% |
| D | 70724 | 2777 | 3.926531% |
Noise dominated data is calculated using 1-second bins in cleaned event files. If a bin has >2000 counts, and if more than 50% of those come from <1% of pixels, then it is considered to be noise-dominated and hence unusable.
| Quadrant | # 1 sec bins | Bins with >0 counts | Bins with >2000 counts | High rate bins dominated by noise | Noise dominated (total time) | Noise dominated (detector-on time) | Marked lightcurve |
|---|---|---|---|---|---|---|---|
| A | 81542 | 70818 | 6684 | 6684 | 8.20% | 9.44% |  |
| B | 81542 | 70875 | 2599 | 2599 | 3.19% | 3.67% |  |
| C | 81542 | 70934 | 66 | 66 | 0.08% | 0.09% |  |
| D | 81542 | 70926 | 1999 | 1999 | 2.45% | 2.82% |  |
Top three noisy pixels from each quadrant. If the there are fewer than three noisy pixels in the level2.evt file, extra rows are filled as -1
| Pixel properties | Quadrant properties | ||||||
|---|---|---|---|---|---|---|---|
| Quadrant | DetID | PixID | Counts | Sigma | Mean | Median | Sigma |
| A | 14 | 238 | 16681124 | 10386.47 | 8015 | 7847 | 1605.3 |
| A | 8 | 5 | 10480005 | 6523.54 | 8015 | 7847 | 1605.3 |
| A | 15 | 174 | 3495208 | 2172.42 | 8015 | 7847 | 1605.3 |
| B | 4 | 239 | 14628398 | 9399.85 | 8301 | 8104 | 1555.4 |
| B | 10 | 244 | 573831 | 363.72 | 8301 | 8104 | 1555.4 |
| B | 4 | 81 | 334822 | 210.06 | 8301 | 8104 | 1555.4 |
| C | 14 | 234 | 114173 | 55.98 | 8220 | 8256 | 1891.9 |
| C | 9 | 54 | 65522 | 30.27 | 8220 | 8256 | 1891.9 |
| C | 13 | 61 | 60132 | 27.42 | 8220 | 8256 | 1891.9 |
| D | 1 | 52 | 4855397 | 2500.09 | 8135 | 7914 | 1938.9 |
| D | 11 | 129 | 3983847 | 2050.59 | 8135 | 7914 | 1938.9 |
| D | 10 | 253 | 2625396 | 1349.97 | 8135 | 7914 | 1938.9 |
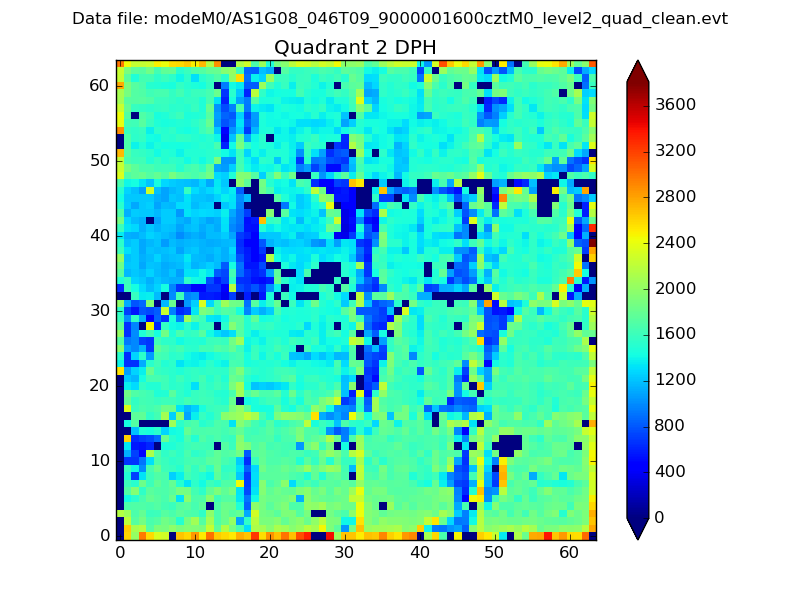
Histogram calculated using DETX and DETY for each event in the final _common_clean file
| Quadrant A | 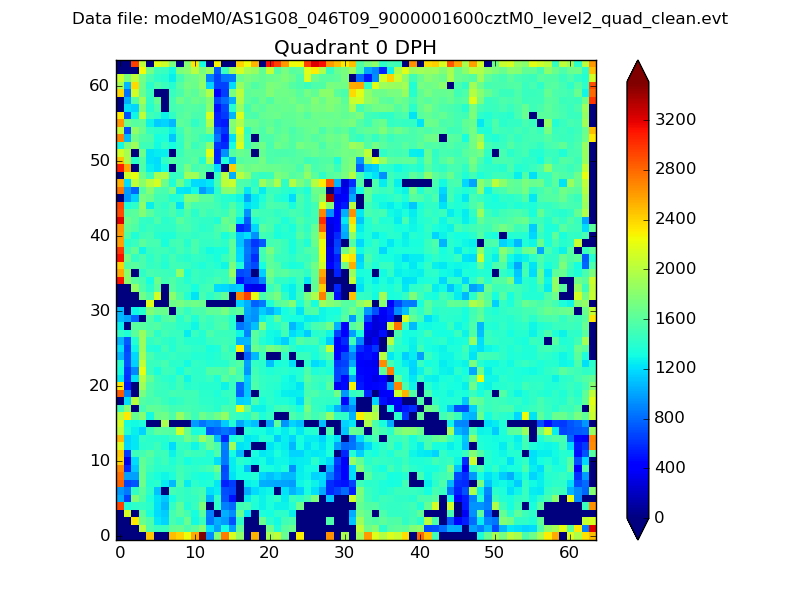 |
 |
Quadrant B |
|---|---|---|---|
| Quadrant D |  |
 |
Quadrant C |
| Plot type | Count rate plots | Images |
|---|---|---|
| Comparison with Poisson distribution Blue bars denote a histogram of data divided into 1 sec bins. Red curve is a Poisson curve with rate = median count rate of data. |
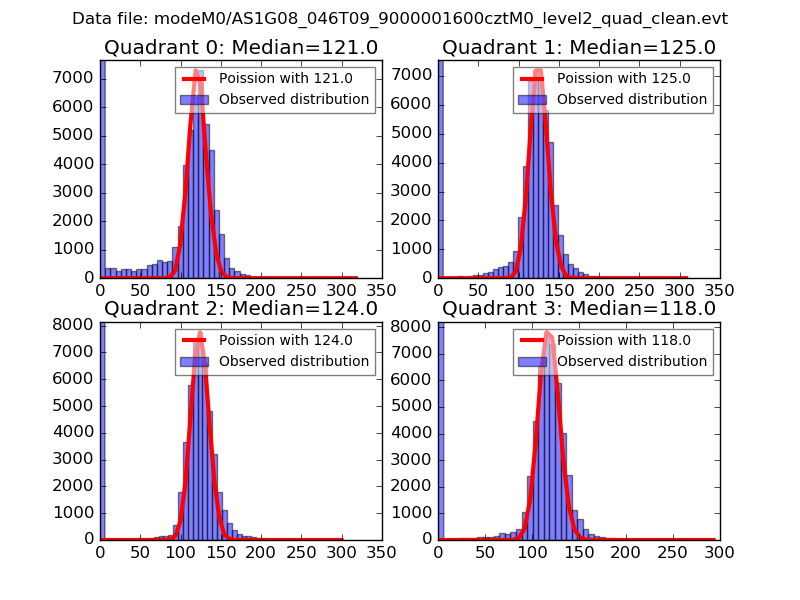 |
 |
| Quadrant-wise count rates Data is divided into 100 sec bins |
 |
|
| Module-wise count rates for Quadrant A Data is divided into 100 sec bins |
 |
 |
| Module-wise count rates for Quadrant B Data is divided into 100 sec bins |
 |
 |
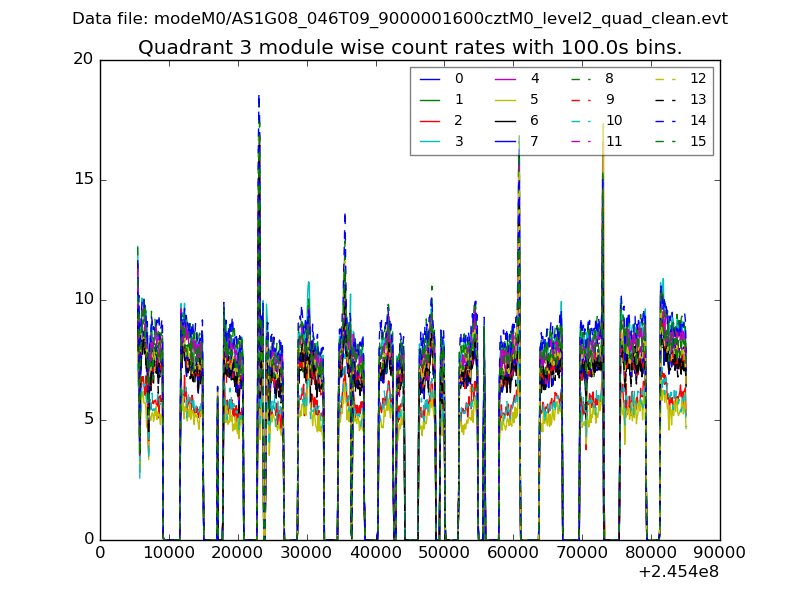
| Module-wise count rates for Quadrant C Data is divided into 100 sec bins |
 |
 |
| Module-wise count rates for Quadrant D Data is divided into 100 sec bins |
 |
 |
| Parameter | Plot |
|---|---|
| CZT HV Monitor |  |
| D_VDD |  |
| Temperature 1 |  |
| Veto HV Monitor | 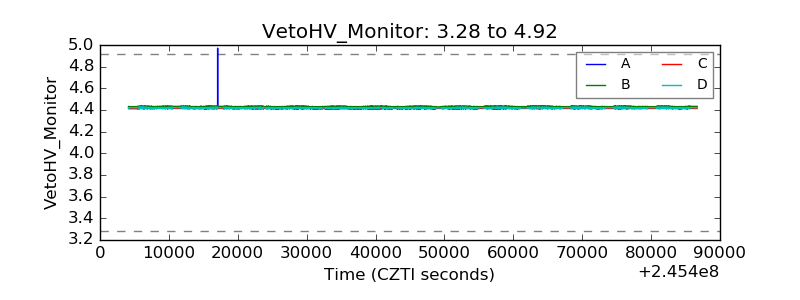 |
| Veto LLD |  |
| Alpha Counter |  |
| _CPM_Rate |  |
| CZT Counter | 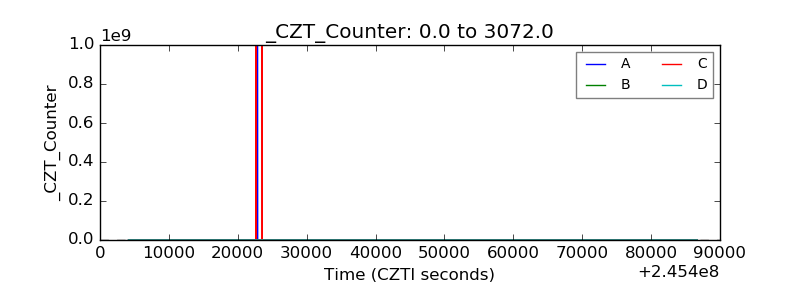 |
| +2.5 Volts monitor |  |
| +5 Volts monitor |  |
| _ROLL_ROT |  |
| _Roll_DEC |  |
| _Roll_RA |  |
| Veto Counter |  |