| Param | Original file | Final file |
|---|---|---|
| Filename | modeM0/AS1C03_004T01_9000001598cztM0_level2.evt | modeM0/AS1C03_004T01_9000001598cztM0_level2_quad_clean.evt |
| Size (bytes) | 1,833,528,960 | 262,221,120 |
| Size | 1.7 GB | 250.1 MB |
| Events in quadrant A | 27,812,667 | 1,829,932 |
| Events in quadrant B | 13,298,038 | 2,291,032 |
| Events in quadrant C | 10,317,656 | 2,338,533 |
| Events in quadrant D | 2,933,748 | 283,291 |
| Mode SS | |||
|---|---|---|---|
| Quadrant | BADHDUFLAG | Total packets | Discarded packets |
| A | 0 | 454 | 0 |
| B | 0 | 440 | 0 |
| C | 0 | 440 | 0 |
| D | 0 | 446 | 0 |
| Mode M9 | |||
|---|---|---|---|
| Quadrant | BADHDUFLAG | Total packets | Discarded packets |
| A | 0 | 57 | 0 |
| B | 0 | 56 | 0 |
| C | 0 | 58 | 0 |
| D | 0 | 56 | 0 |
| Mode M0 | |||
|---|---|---|---|
| Quadrant | BADHDUFLAG | Total packets | Discarded packets |
| A | 0 | 97378 | 0 |
| B | 0 | 53209 | 0 |
| C | 0 | 44925 | 0 |
| D | 0 | 10862 | 0 |
| Quadrant | Total seconds | Saturated seconds | Saturation percentage |
|---|---|---|---|
| A | 21417 | 6187 | 28.888266% |
| B | 21721 | 817 | 3.761337% |
| C | 21877 | 70 | 0.319971% |
| D | 3137 | 181 | 5.769844% |
Noise dominated data is calculated using 1-second bins in cleaned event files. If a bin has >2000 counts, and if more than 50% of those come from <1% of pixels, then it is considered to be noise-dominated and hence unusable.
| Quadrant | # 1 sec bins | Bins with >0 counts | Bins with >2000 counts | High rate bins dominated by noise | Noise dominated (total time) | Noise dominated (detector-on time) | Marked lightcurve |
|---|---|---|---|---|---|---|---|
| A | 30028 | 22502 | 4941 | 4941 | 16.45% | 21.96% |  |
| B | 30028 | 22743 | 474 | 474 | 1.58% | 2.08% |  |
| C | 30028 | 22898 | 0 | 0 | 0.00% | 0.00% |  |
| D | 6539 | 3902 | 126 | 126 | 1.93% | 3.23% |  |
Top three noisy pixels from each quadrant. If the there are fewer than three noisy pixels in the level2.evt file, extra rows are filled as -1
| Pixel properties | Quadrant properties | ||||||
|---|---|---|---|---|---|---|---|
| Quadrant | DetID | PixID | Counts | Sigma | Mean | Median | Sigma |
| A | 14 | 238 | 17179101 | 38068.72 | 2274 | 2229 | 451.2 |
| A | 8 | 5 | 1562873 | 3458.82 | 2274 | 2229 | 451.2 |
| A | 15 | 174 | 136372 | 297.3 | 2274 | 2229 | 451.2 |
| B | 4 | 239 | 2587439 | 5396.63 | 2630 | 2573 | 479.0 |
| B | 15 | 204 | 164666 | 338.41 | 2630 | 2573 | 479.0 |
| B | 0 | 214 | 112524 | 229.55 | 2630 | 2573 | 479.0 |
| C | 13 | 61 | 19473 | 28.24 | 2639 | 2654 | 595.6 |
| C | 8 | 128 | 10379 | 12.97 | 2639 | 2654 | 595.6 |
| C | 12 | 4 | 8565 | 9.92 | 2639 | 2654 | 595.6 |
| D | 1 | 52 | 862940 | 9954.85 | 353 | 342 | 86.7 |
| D | 11 | 129 | 241733 | 2785.78 | 353 | 342 | 86.7 |
| D | 8 | 195 | 162756 | 1874.35 | 353 | 342 | 86.7 |
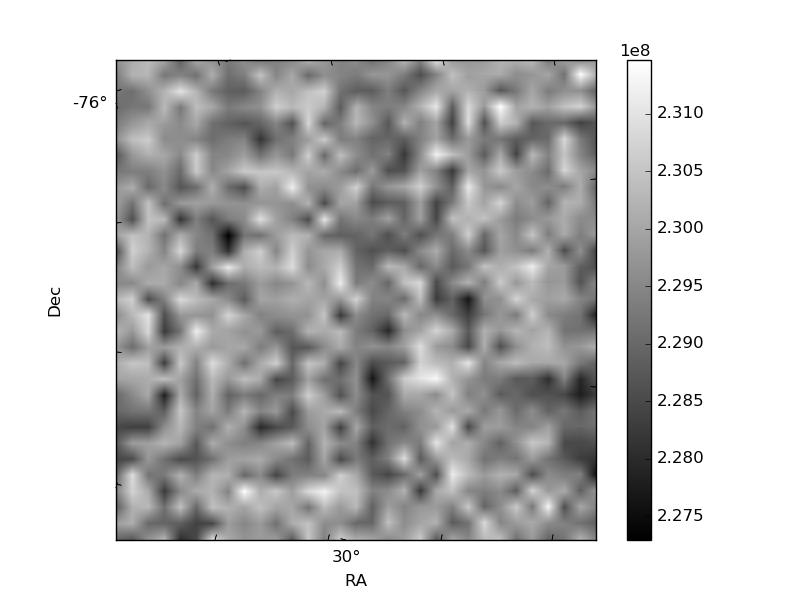
Histogram calculated using DETX and DETY for each event in the final _common_clean file
| Quadrant A |  |
 |
Quadrant B |
|---|---|---|---|
| Quadrant D |  |
 |
Quadrant C |
| Plot type | Count rate plots | Images |
|---|---|---|
| Comparison with Poisson distribution Blue bars denote a histogram of data divided into 1 sec bins. Red curve is a Poisson curve with rate = median count rate of data. |
 |
 |
| Quadrant-wise count rates Data is divided into 100 sec bins |
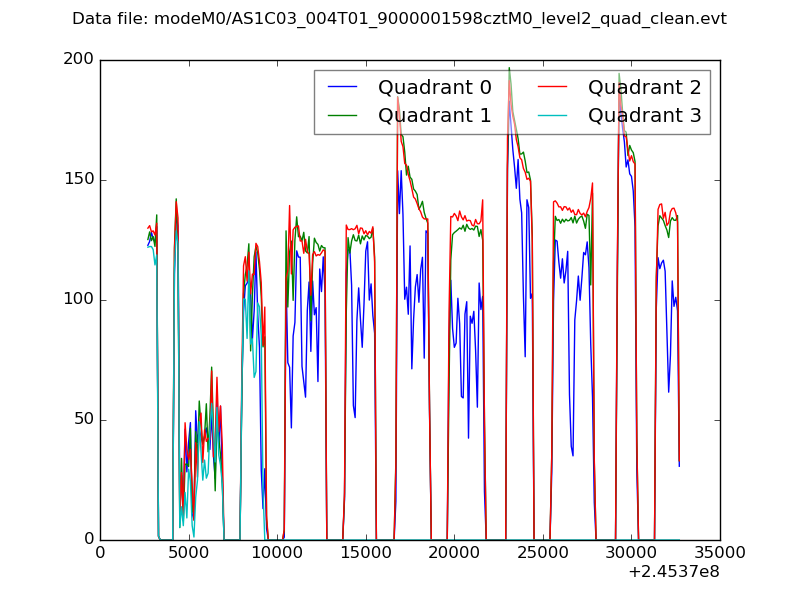 |
|
| Module-wise count rates for Quadrant A Data is divided into 100 sec bins |
 |
 |
| Module-wise count rates for Quadrant B Data is divided into 100 sec bins |
 |
 |
| Module-wise count rates for Quadrant C Data is divided into 100 sec bins |
 |
 |
| Module-wise count rates for Quadrant D Data is divided into 100 sec bins |
 |
 |
| Parameter | Plot |
|---|---|
| CZT HV Monitor |  |
| D_VDD |  |
| Temperature 1 |  |
| Veto HV Monitor |  |
| Veto LLD |  |
| Alpha Counter |  |
| _CPM_Rate |  |
| CZT Counter |  |
| +2.5 Volts monitor |  |
| +5 Volts monitor |  |
| _ROLL_ROT |  |
| _Roll_DEC |  |
| _Roll_RA |  |
| Veto Counter |  |