| Param | Original file | Final file |
|---|---|---|
| Filename | modeM0/AS1G08_030T01_9000001592cztM0_level2.evt | modeM0/AS1G08_030T01_9000001592cztM0_level2_quad_clean.evt |
| Size (bytes) | 1,601,219,520 | 239,590,080 |
| Size | 1.5 GB | 228.5 MB |
| Events in quadrant A | 15,648,428 | 1,439,346 |
| Events in quadrant B | 11,769,630 | 1,545,208 |
| Events in quadrant C | 8,808,277 | 1,536,447 |
| Events in quadrant D | 11,008,902 | 1,449,337 |
| Mode SS | |||
|---|---|---|---|
| Quadrant | BADHDUFLAG | Total packets | Discarded packets |
| A | 0 | 382 | 0 |
| B | 0 | 382 | 0 |
| C | 0 | 382 | 0 |
| D | 0 | 382 | 0 |
| Mode M9 | |||
|---|---|---|---|
| Quadrant | BADHDUFLAG | Total packets | Discarded packets |
| A | 0 | 46 | 0 |
| B | 0 | 46 | 0 |
| C | 0 | 46 | 0 |
| D | 0 | 46 | 0 |
| Mode M0 | |||
|---|---|---|---|
| Quadrant | BADHDUFLAG | Total packets | Discarded packets |
| A | 0 | 58777 | 0 |
| B | 0 | 46823 | 0 |
| C | 0 | 38338 | 0 |
| D | 0 | 44914 | 0 |
| Quadrant | Total seconds | Saturated seconds | Saturation percentage |
|---|---|---|---|
| A | 18652 | 2049 | 10.985417% |
| B | 18652 | 755 | 4.047823% |
| C | 18652 | 85 | 0.455715% |
| D | 18652 | 286 | 1.533348% |
Noise dominated data is calculated using 1-second bins in cleaned event files. If a bin has >2000 counts, and if more than 50% of those come from <1% of pixels, then it is considered to be noise-dominated and hence unusable.
| Quadrant | # 1 sec bins | Bins with >0 counts | Bins with >2000 counts | High rate bins dominated by noise | Noise dominated (total time) | Noise dominated (detector-on time) | Marked lightcurve |
|---|---|---|---|---|---|---|---|
| A | 23337 | 18655 | 1586 | 1586 | 6.80% | 8.50% |  |
| B | 23337 | 18653 | 374 | 374 | 1.60% | 2.01% |  |
| C | 23337 | 18656 | 2 | 2 | 0.01% | 0.01% |  |
| D | 23337 | 18656 | 157 | 157 | 0.67% | 0.84% | 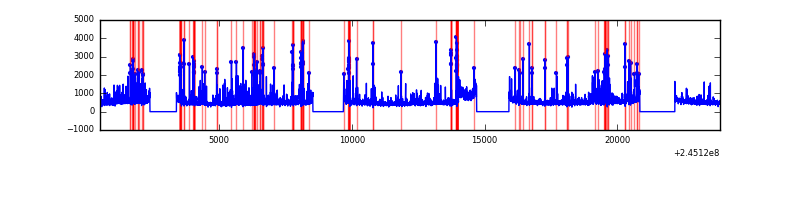 |
Top three noisy pixels from each quadrant. If the there are fewer than three noisy pixels in the level2.evt file, extra rows are filled as -1
| Pixel properties | Quadrant properties | ||||||
|---|---|---|---|---|---|---|---|
| Quadrant | DetID | PixID | Counts | Sigma | Mean | Median | Sigma |
| A | 8 | 5 | 4437535 | 9841.88 | 2242 | 2203 | 450.7 |
| A | 13 | 210 | 2477964 | 5493.64 | 2242 | 2203 | 450.7 |
| A | 13 | 251 | 41916 | 88.12 | 2242 | 2203 | 450.7 |
| B | 4 | 239 | 2428997 | 5568.39 | 2321 | 2269 | 435.8 |
| B | 0 | 214 | 65265 | 144.55 | 2321 | 2269 | 435.8 |
| B | 15 | 204 | 53023 | 116.46 | 2321 | 2269 | 435.8 |
| C | 14 | 234 | 17191 | 28.88 | 2255 | 2274 | 516.6 |
| C | 13 | 61 | 16682 | 27.89 | 2255 | 2274 | 516.6 |
| C | 5 | 207 | 5788 | 6.8 | 2255 | 2274 | 516.6 |
| D | 1 | 52 | 1356926 | 2547.44 | 2240 | 2188 | 531.8 |
| D | 5 | 222 | 346613 | 647.65 | 2240 | 2188 | 531.8 |
| D | 13 | 104 | 258610 | 482.17 | 2240 | 2188 | 531.8 |
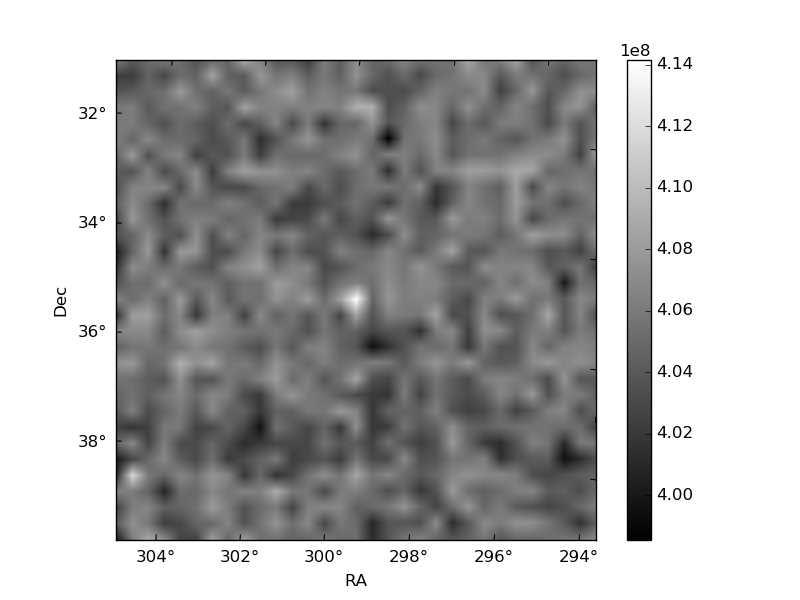
Histogram calculated using DETX and DETY for each event in the final _common_clean file
| Quadrant A |  |
 |
Quadrant B |
|---|---|---|---|
| Quadrant D |  |
 |
Quadrant C |
| Plot type | Count rate plots | Images |
|---|---|---|
| Comparison with Poisson distribution Blue bars denote a histogram of data divided into 1 sec bins. Red curve is a Poisson curve with rate = median count rate of data. |
 |
 |
| Quadrant-wise count rates Data is divided into 100 sec bins |
 |
|
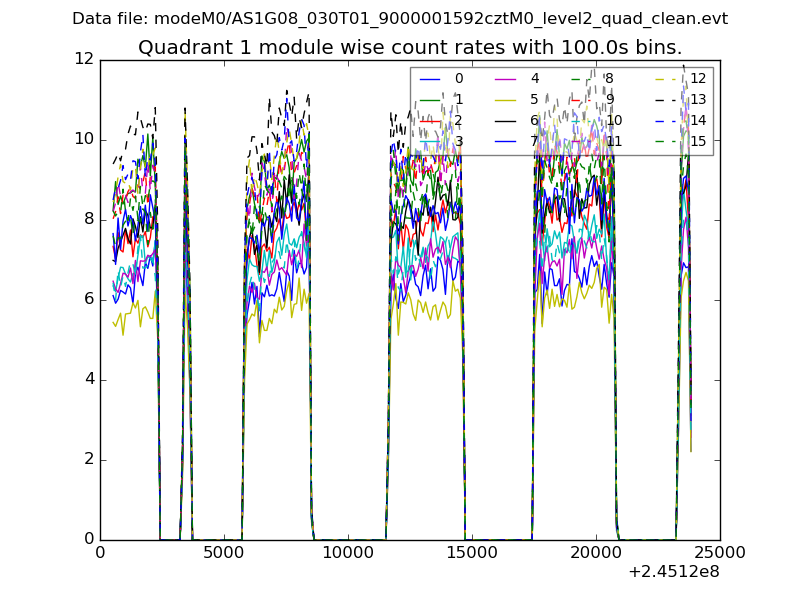
| Module-wise count rates for Quadrant A Data is divided into 100 sec bins |
 |
 |
| Module-wise count rates for Quadrant B Data is divided into 100 sec bins |
 |
 |
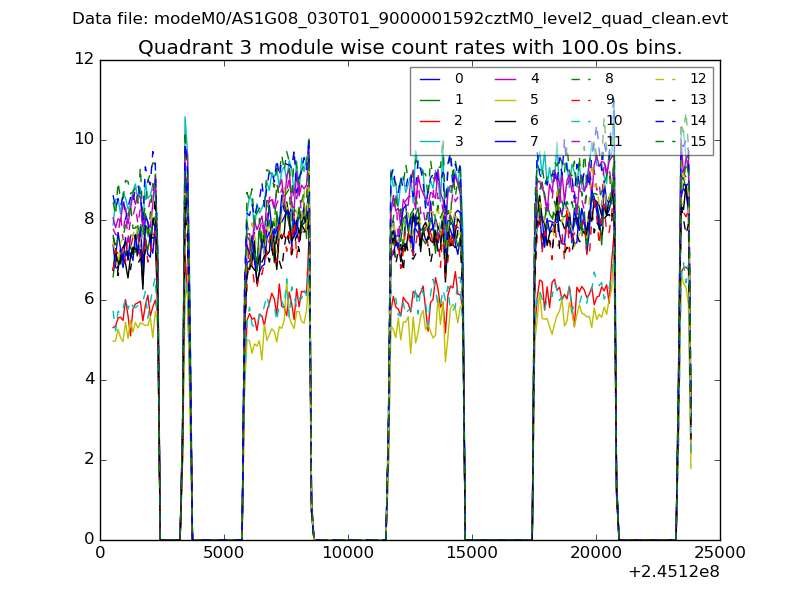
| Module-wise count rates for Quadrant C Data is divided into 100 sec bins |
 |
 |
| Module-wise count rates for Quadrant D Data is divided into 100 sec bins |
 |
 |
| Parameter | Plot |
|---|---|
| CZT HV Monitor |  |
| D_VDD |  |
| Temperature 1 | 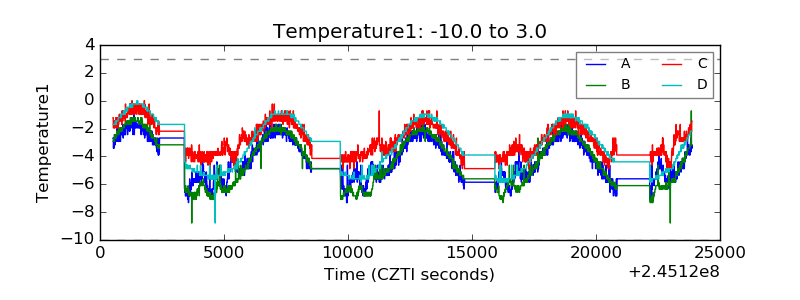 |
| Veto HV Monitor | 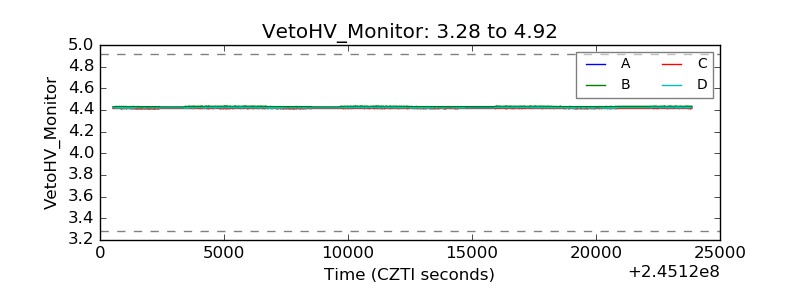 |
| Veto LLD | 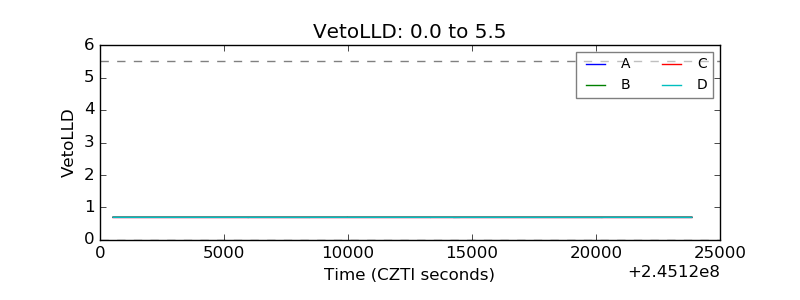 |
| Alpha Counter |  |
| _CPM_Rate |  |
| CZT Counter | 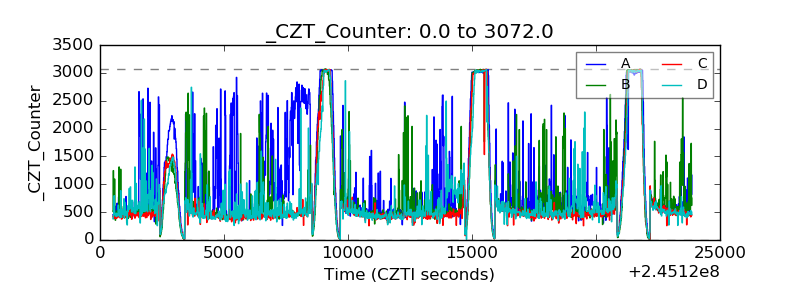 |
| +2.5 Volts monitor |  |
| +5 Volts monitor |  |
| _ROLL_ROT |  |
| _Roll_DEC |  |
| _Roll_RA |  |
| Veto Counter | 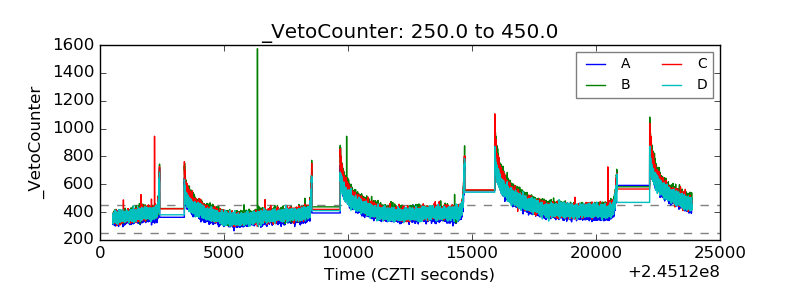 |