| Param | Original file | Final file |
|---|---|---|
| Filename | modeM0/AS1T01_193T01_9000001590cztM0_level2.evt | modeM0/AS1T01_193T01_9000001590cztM0_level2_quad_clean.evt |
| Size (bytes) | 5,177,862,720 | 994,518,720 |
| Size | 4.8 GB | 948.4 MB |
| Events in quadrant A | 43,497,524 | 6,407,528 |
| Events in quadrant B | 38,667,677 | 6,587,225 |
| Events in quadrant C | 28,050,340 | 6,703,216 |
| Events in quadrant D | 42,400,677 | 6,151,596 |
| Mode SS | |||
|---|---|---|---|
| Quadrant | BADHDUFLAG | Total packets | Discarded packets |
| A | 0 | 1272 | 0 |
| B | 0 | 1270 | 0 |
| C | 0 | 1272 | 0 |
| D | 0 | 1270 | 0 |
| Mode M0 | |||
|---|---|---|---|
| Quadrant | BADHDUFLAG | Total packets | Discarded packets |
| A | 0 | 170887 | 0 |
| B | 0 | 156081 | 0 |
| C | 0 | 127177 | 0 |
| D | 0 | 168622 | 0 |
| Mode M9 | |||
|---|---|---|---|
| Quadrant | BADHDUFLAG | Total packets | Discarded packets |
| A | 0 | 96 | 0 |
| B | 0 | 96 | 0 |
| C | 0 | 97 | 0 |
| D | 0 | 96 | 0 |
| Quadrant | Total seconds | Saturated seconds | Saturation percentage |
|---|---|---|---|
| A | 62275 | 3786 | 6.079486% |
| B | 62287 | 3061 | 4.914348% |
| C | 62347 | 432 | 0.692896% |
| D | 62223 | 4500 | 7.232052% |
Noise dominated data is calculated using 1-second bins in cleaned event files. If a bin has >2000 counts, and if more than 50% of those come from <1% of pixels, then it is considered to be noise-dominated and hence unusable.
| Quadrant | # 1 sec bins | Bins with >0 counts | Bins with >2000 counts | High rate bins dominated by noise | Noise dominated (total time) | Noise dominated (detector-on time) | Marked lightcurve |
|---|---|---|---|---|---|---|---|
| A | 71568 | 62540 | 2401 | 2401 | 3.35% | 3.84% |  |
| B | 71568 | 62563 | 1632 | 1632 | 2.28% | 2.61% | 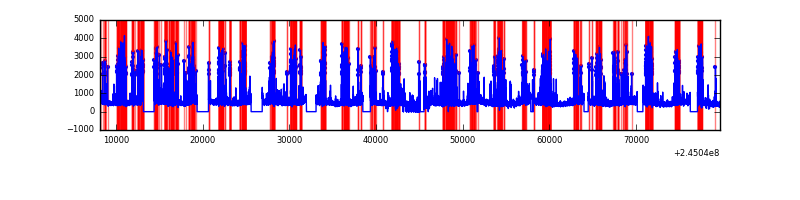 |
| C | 71568 | 62612 | 1 | 1 | 0.00% | 0.00% | 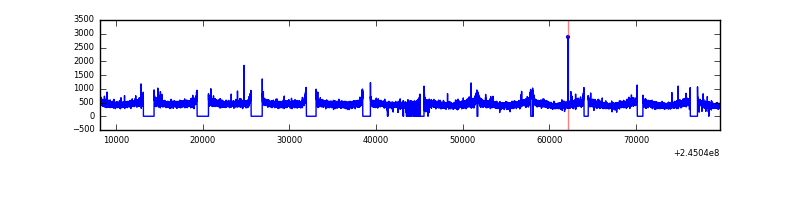 |
| D | 71568 | 62486 | 3456 | 3456 | 4.83% | 5.53% |  |
Top three noisy pixels from each quadrant. If the there are fewer than three noisy pixels in the level2.evt file, extra rows are filled as -1
| Pixel properties | Quadrant properties | ||||||
|---|---|---|---|---|---|---|---|
| Quadrant | DetID | PixID | Counts | Sigma | Mean | Median | Sigma |
| A | 8 | 5 | 14641193 | 10103.58 | 7200 | 7066 | 1448.4 |
| A | 8 | 15 | 658067 | 449.46 | 7200 | 7066 | 1448.4 |
| A | 13 | 210 | 200826 | 133.77 | 7200 | 7066 | 1448.4 |
| B | 4 | 239 | 8672074 | 6373.04 | 7286 | 7123 | 1359.6 |
| B | 0 | 214 | 384193 | 277.33 | 7286 | 7123 | 1359.6 |
| B | 4 | 173 | 313377 | 225.25 | 7286 | 7123 | 1359.6 |
| C | 13 | 61 | 53580 | 28.34 | 7184 | 7227 | 1635.7 |
| C | 8 | 222 | 23037 | 9.67 | 7184 | 7227 | 1635.7 |
| C | 14 | 234 | 18279 | 6.76 | 7184 | 7227 | 1635.7 |
| D | 10 | 253 | 7533018 | 4558.87 | 6898 | 6715 | 1650.9 |
| D | 1 | 52 | 4421910 | 2674.4 | 6898 | 6715 | 1650.9 |
| D | 5 | 222 | 900992 | 541.69 | 6898 | 6715 | 1650.9 |
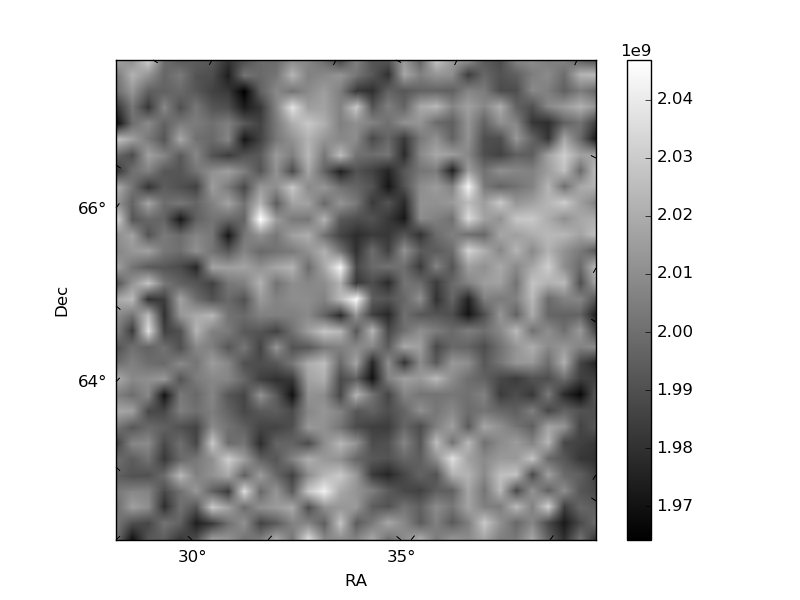
Histogram calculated using DETX and DETY for each event in the final _common_clean file
| Quadrant A | 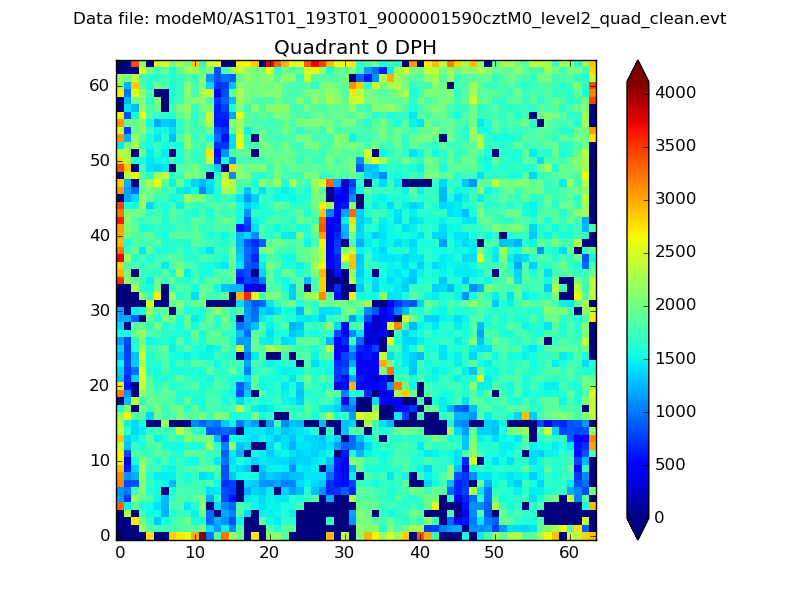 |
 |
Quadrant B |
|---|---|---|---|
| Quadrant D |  |
 |
Quadrant C |
| Plot type | Count rate plots | Images |
|---|---|---|
| Comparison with Poisson distribution Blue bars denote a histogram of data divided into 1 sec bins. Red curve is a Poisson curve with rate = median count rate of data. |
 |
 |
| Quadrant-wise count rates Data is divided into 100 sec bins |
 |
|
| Module-wise count rates for Quadrant A Data is divided into 100 sec bins |
 |
 |
| Module-wise count rates for Quadrant B Data is divided into 100 sec bins |
 |
 |
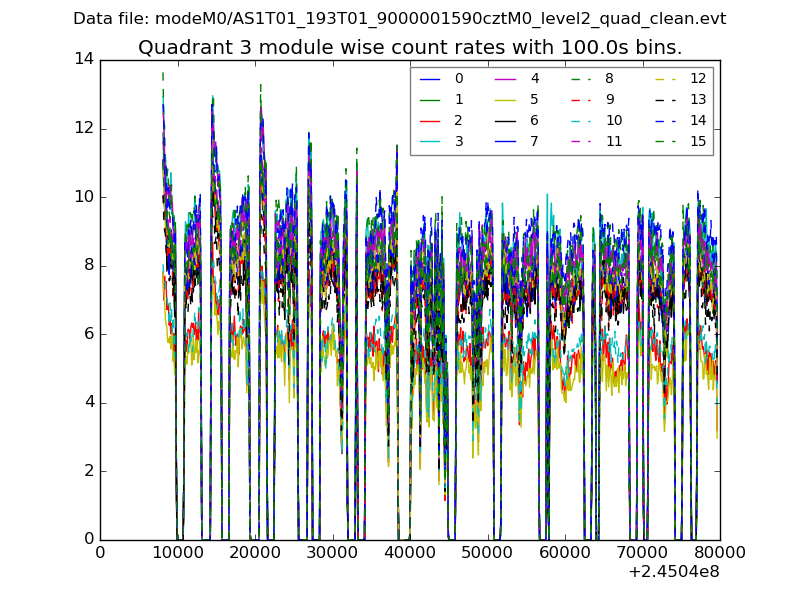
| Module-wise count rates for Quadrant C Data is divided into 100 sec bins |
 |
 |
| Module-wise count rates for Quadrant D Data is divided into 100 sec bins |
 |
 |
| Parameter | Plot |
|---|---|
| CZT HV Monitor |  |
| D_VDD | 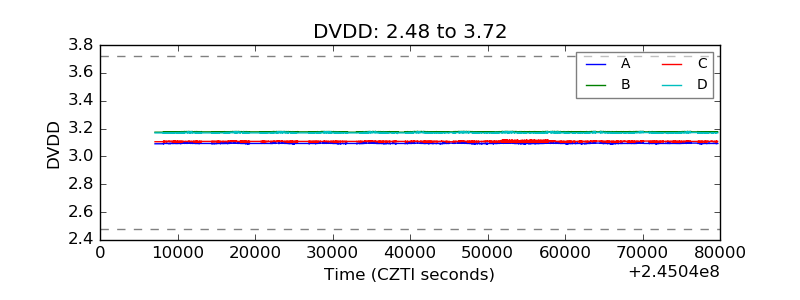 |
| Temperature 1 |  |
| Veto HV Monitor |  |
| Veto LLD |  |
| Alpha Counter |  |
| _CPM_Rate |  |
| CZT Counter |  |
| +2.5 Volts monitor |  |
| +5 Volts monitor |  |
| _ROLL_ROT |  |
| _Roll_DEC | 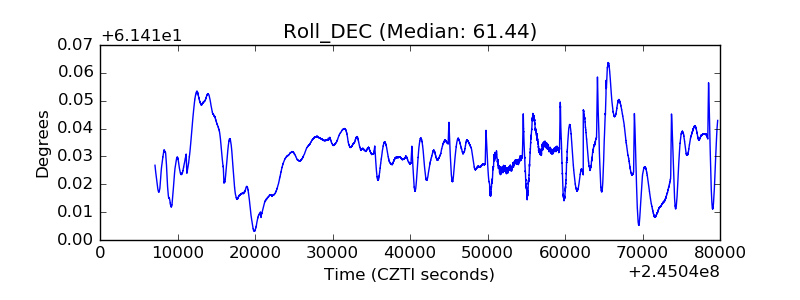 |
| _Roll_RA |  |
| Veto Counter |  |