| Param | Original file | Final file |
|---|---|---|
| Filename | modeM0/AS1G08_037T01_9000001588cztM0_level2.evt | modeM0/AS1G08_037T01_9000001588cztM0_level2_quad_clean.evt |
| Size (bytes) | 3,961,310,400 | 520,323,840 |
| Size | 3.7 GB | 496.2 MB |
| Events in quadrant A | 35,580,928 | 3,171,573 |
| Events in quadrant B | 29,611,097 | 3,272,253 |
| Events in quadrant C | 20,361,946 | 3,285,022 |
| Events in quadrant D | 31,379,546 | 2,932,650 |
| Mode SS | |||
|---|---|---|---|
| Quadrant | BADHDUFLAG | Total packets | Discarded packets |
| A | 0 | 926 | 0 |
| B | 0 | 920 | 0 |
| C | 0 | 920 | 0 |
| D | 0 | 922 | 0 |
| Mode M0 | |||
|---|---|---|---|
| Quadrant | BADHDUFLAG | Total packets | Discarded packets |
| A | 0 | 136343 | 0 |
| B | 0 | 117470 | 0 |
| C | 0 | 92318 | 0 |
| D | 0 | 123958 | 0 |
| Mode M9 | |||
|---|---|---|---|
| Quadrant | BADHDUFLAG | Total packets | Discarded packets |
| A | 0 | 47 | 0 |
| B | 0 | 47 | 0 |
| C | 0 | 47 | 0 |
| D | 0 | 47 | 0 |
| Quadrant | Total seconds | Saturated seconds | Saturation percentage |
|---|---|---|---|
| A | 45089 | 2714 | 6.019206% |
| B | 45142 | 2292 | 5.077312% |
| C | 45198 | 182 | 0.402673% |
| D | 44900 | 3386 | 7.541203% |
Noise dominated data is calculated using 1-second bins in cleaned event files. If a bin has >2000 counts, and if more than 50% of those come from <1% of pixels, then it is considered to be noise-dominated and hence unusable.
| Quadrant | # 1 sec bins | Bins with >0 counts | Bins with >2000 counts | High rate bins dominated by noise | Noise dominated (total time) | Noise dominated (detector-on time) | Marked lightcurve |
|---|---|---|---|---|---|---|---|
| A | 50294 | 45517 | 1532 | 1532 | 3.05% | 3.37% |  |
| B | 50294 | 45530 | 1185 | 1185 | 2.36% | 2.60% |  |
| C | 50294 | 45542 | 3 | 3 | 0.01% | 0.01% |  |
| D | 50294 | 45321 | 2440 | 2440 | 4.85% | 5.38% |  |
Top three noisy pixels from each quadrant. If the there are fewer than three noisy pixels in the level2.evt file, extra rows are filled as -1
| Pixel properties | Quadrant properties | ||||||
|---|---|---|---|---|---|---|---|
| Quadrant | DetID | PixID | Counts | Sigma | Mean | Median | Sigma |
| A | 8 | 5 | 9493928 | 8892.93 | 5266 | 5153 | 1067.0 |
| A | 8 | 15 | 4189948 | 3922.01 | 5266 | 5153 | 1067.0 |
| A | 14 | 238 | 892078 | 831.23 | 5266 | 5153 | 1067.0 |
| B | 4 | 239 | 7751022 | 7657.98 | 5324 | 5195 | 1011.5 |
| B | 0 | 214 | 260647 | 252.55 | 5324 | 5195 | 1011.5 |
| B | 0 | 219 | 189378 | 182.09 | 5324 | 5195 | 1011.5 |
| C | 13 | 61 | 38948 | 28.0 | 5205 | 5224 | 1204.4 |
| C | 8 | 222 | 23072 | 14.82 | 5205 | 5224 | 1204.4 |
| C | 8 | 128 | 23001 | 14.76 | 5205 | 5224 | 1204.4 |
| D | 1 | 52 | 5798587 | 4823.67 | 4974 | 4832 | 1201.1 |
| D | 13 | 152 | 2978045 | 2475.39 | 4974 | 4832 | 1201.1 |
| D | 10 | 253 | 1113399 | 922.95 | 4974 | 4832 | 1201.1 |
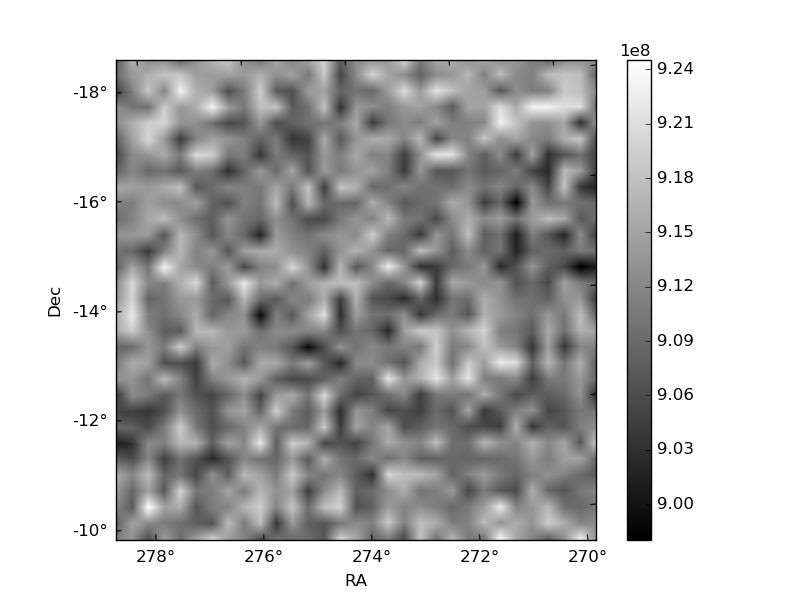
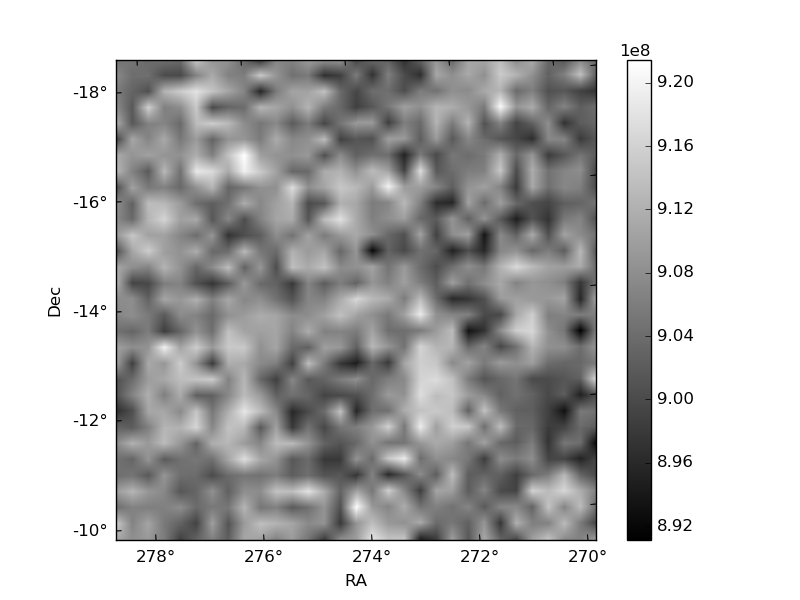
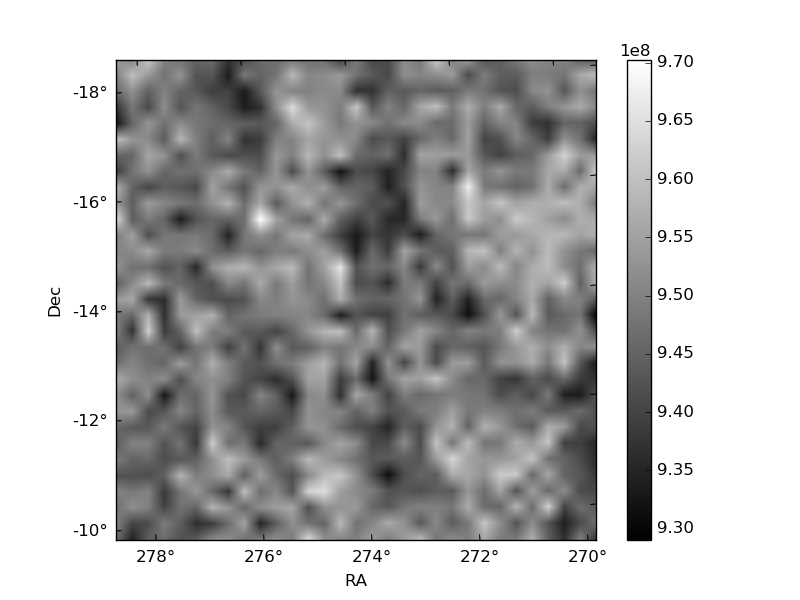
Histogram calculated using DETX and DETY for each event in the final _common_clean file
| Quadrant A |  |
 |
Quadrant B |
|---|---|---|---|
| Quadrant D |  |
 |
Quadrant C |
| Plot type | Count rate plots | Images |
|---|---|---|
| Comparison with Poisson distribution Blue bars denote a histogram of data divided into 1 sec bins. Red curve is a Poisson curve with rate = median count rate of data. |
 |
 |
| Quadrant-wise count rates Data is divided into 100 sec bins |
 |
|
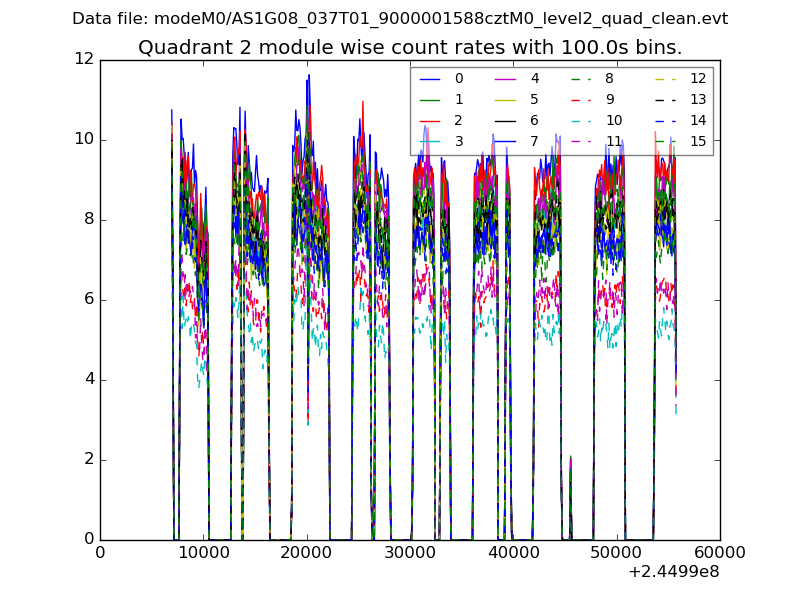
| Module-wise count rates for Quadrant A Data is divided into 100 sec bins |
 |
 |
| Module-wise count rates for Quadrant B Data is divided into 100 sec bins |
 |
 |
| Module-wise count rates for Quadrant C Data is divided into 100 sec bins |
 |
 |
| Module-wise count rates for Quadrant D Data is divided into 100 sec bins |
 |
 |
| Parameter | Plot |
|---|---|
| CZT HV Monitor |  |
| D_VDD |  |
| Temperature 1 |  |
| Veto HV Monitor | 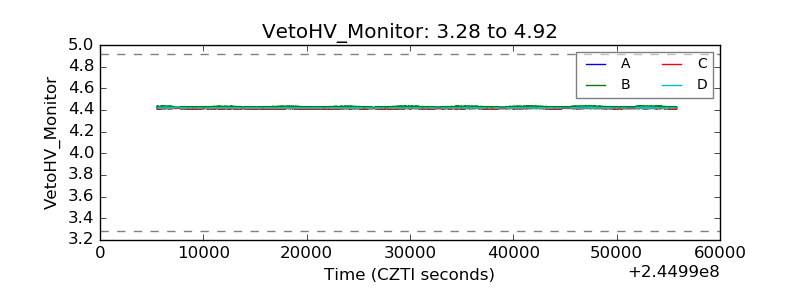 |
| Veto LLD |  |
| Alpha Counter |  |
| _CPM_Rate |  |
| CZT Counter | 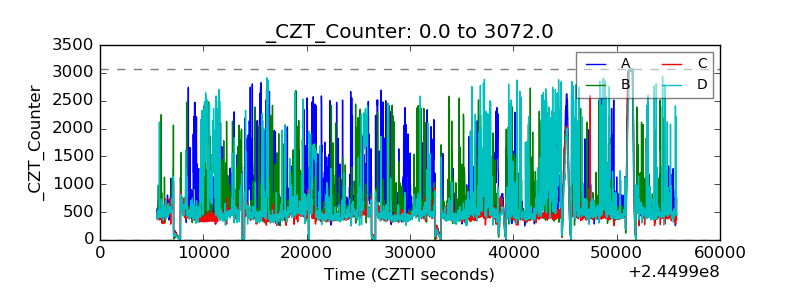 |
| +2.5 Volts monitor |  |
| +5 Volts monitor |  |
| _ROLL_ROT |  |
| _Roll_DEC |  |
| _Roll_RA | 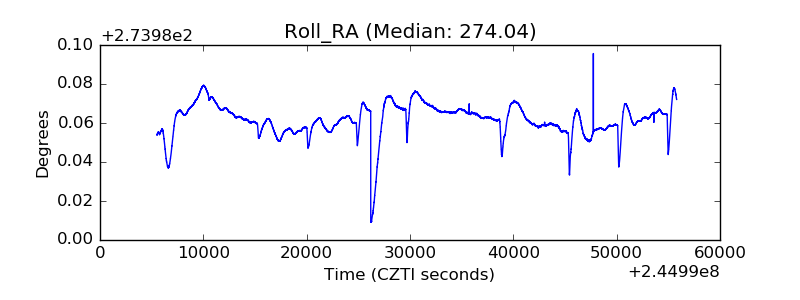 |
| Veto Counter |  |