| Param | Original file | Final file |
|---|---|---|
| Filename | modeM0/AS1C03_013T01_9000001586cztM0_level2.evt | modeM0/AS1C03_013T01_9000001586cztM0_level2_quad_clean.evt |
| Size (bytes) | 2,728,941,120 | 374,788,800 |
| Size | 2.5 GB | 357.4 MB |
| Events in quadrant A | 17,956,711 | 2,345,850 |
| Events in quadrant B | 23,754,331 | 2,311,989 |
| Events in quadrant C | 15,631,965 | 2,339,630 |
| Events in quadrant D | 23,108,831 | 2,114,565 |
| Mode SS | |||
|---|---|---|---|
| Quadrant | BADHDUFLAG | Total packets | Discarded packets |
| A | 0 | 664 | 0 |
| B | 0 | 664 | 0 |
| C | 0 | 664 | 0 |
| D | 0 | 664 | 0 |
| Mode M9 | |||
|---|---|---|---|
| Quadrant | BADHDUFLAG | Total packets | Discarded packets |
| A | 0 | 77 | 0 |
| B | 0 | 77 | 0 |
| C | 0 | 77 | 0 |
| D | 0 | 77 | 0 |
| Mode M0 | |||
|---|---|---|---|
| Quadrant | BADHDUFLAG | Total packets | Discarded packets |
| A | 0 | 73487 | 0 |
| B | 0 | 91330 | 0 |
| C | 0 | 67199 | 0 |
| D | 0 | 89964 | 0 |
| Quadrant | Total seconds | Saturated seconds | Saturation percentage |
|---|---|---|---|
| A | 32569 | 679 | 2.084805% |
| B | 32571 | 2423 | 7.439133% |
| C | 32571 | 252 | 0.773694% |
| D | 32568 | 2348 | 7.209531% |
Noise dominated data is calculated using 1-second bins in cleaned event files. If a bin has >2000 counts, and if more than 50% of those come from <1% of pixels, then it is considered to be noise-dominated and hence unusable.
| Quadrant | # 1 sec bins | Bins with >0 counts | Bins with >2000 counts | High rate bins dominated by noise | Noise dominated (total time) | Noise dominated (detector-on time) | Marked lightcurve |
|---|---|---|---|---|---|---|---|
| A | 39838 | 32592 | 183 | 183 | 0.46% | 0.56% |  |
| B | 39838 | 32589 | 1441 | 1441 | 3.62% | 4.42% |  |
| C | 39838 | 32593 | 4 | 4 | 0.01% | 0.01% |  |
| D | 39838 | 32587 | 1760 | 1760 | 4.42% | 5.40% |  |
Top three noisy pixels from each quadrant. If the there are fewer than three noisy pixels in the level2.evt file, extra rows are filled as -1
| Pixel properties | Quadrant properties | ||||||
|---|---|---|---|---|---|---|---|
| Quadrant | DetID | PixID | Counts | Sigma | Mean | Median | Sigma |
| A | 8 | 5 | 1620866 | 1965.19 | 4105 | 4032 | 822.7 |
| A | 15 | 174 | 106161 | 124.13 | 4105 | 4032 | 822.7 |
| A | 8 | 15 | 92018 | 106.94 | 4105 | 4032 | 822.7 |
| B | 4 | 239 | 7466457 | 9954.23 | 4010 | 3918 | 749.7 |
| B | 0 | 214 | 178285 | 232.59 | 4010 | 3918 | 749.7 |
| B | 0 | 219 | 133662 | 173.06 | 4010 | 3918 | 749.7 |
| C | 14 | 234 | 121362 | 128.26 | 3977 | 3996 | 915.1 |
| C | 13 | 61 | 29633 | 28.02 | 3977 | 3996 | 915.1 |
| C | 8 | 222 | 14313 | 11.27 | 3977 | 3996 | 915.1 |
| D | 1 | 52 | 6526254 | 6999.07 | 3853 | 3743 | 931.9 |
| D | 5 | 222 | 746299 | 796.81 | 3853 | 3743 | 931.9 |
| D | 5 | 97 | 302920 | 321.04 | 3853 | 3743 | 931.9 |
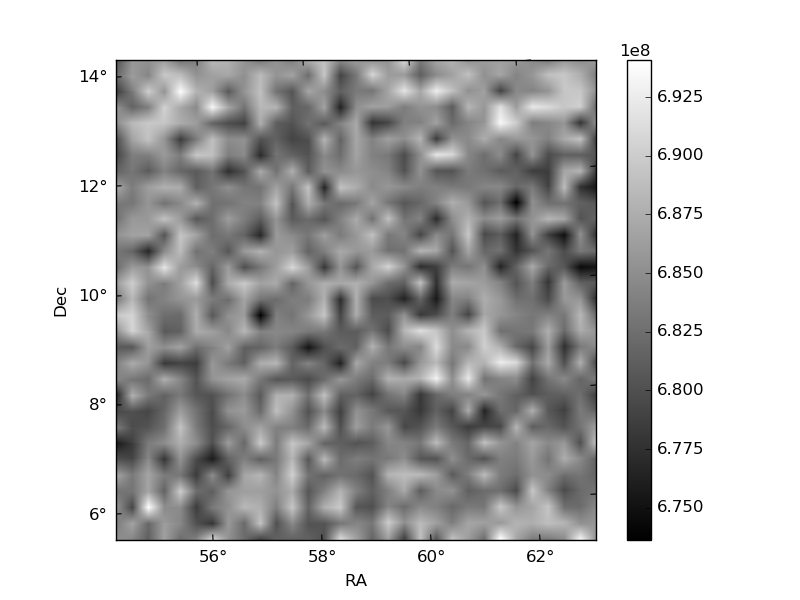
Histogram calculated using DETX and DETY for each event in the final _common_clean file
| Quadrant A |  |
 |
Quadrant B |
|---|---|---|---|
| Quadrant D |  |
 |
Quadrant C |
| Plot type | Count rate plots | Images |
|---|---|---|
| Comparison with Poisson distribution Blue bars denote a histogram of data divided into 1 sec bins. Red curve is a Poisson curve with rate = median count rate of data. |
 |
 |
| Quadrant-wise count rates Data is divided into 100 sec bins |
 |
|
| Module-wise count rates for Quadrant A Data is divided into 100 sec bins |
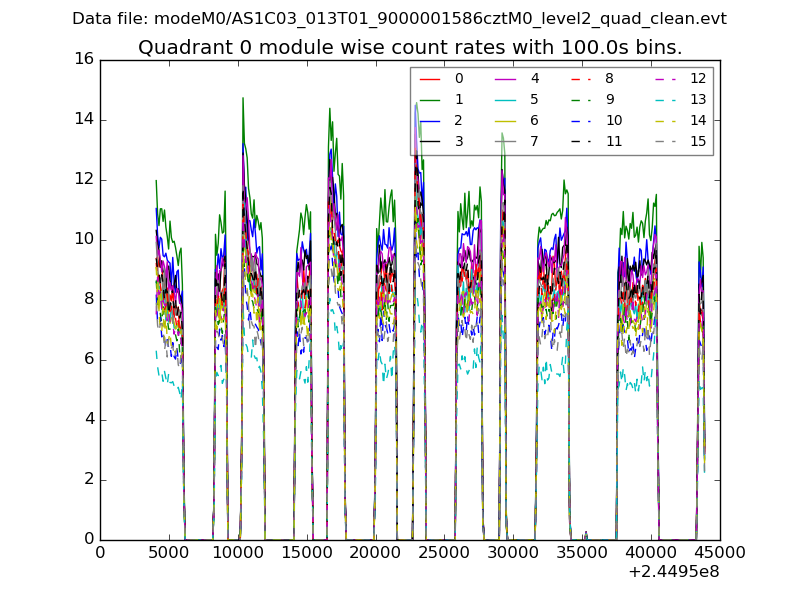 |
 |
| Module-wise count rates for Quadrant B Data is divided into 100 sec bins |
 |
 |
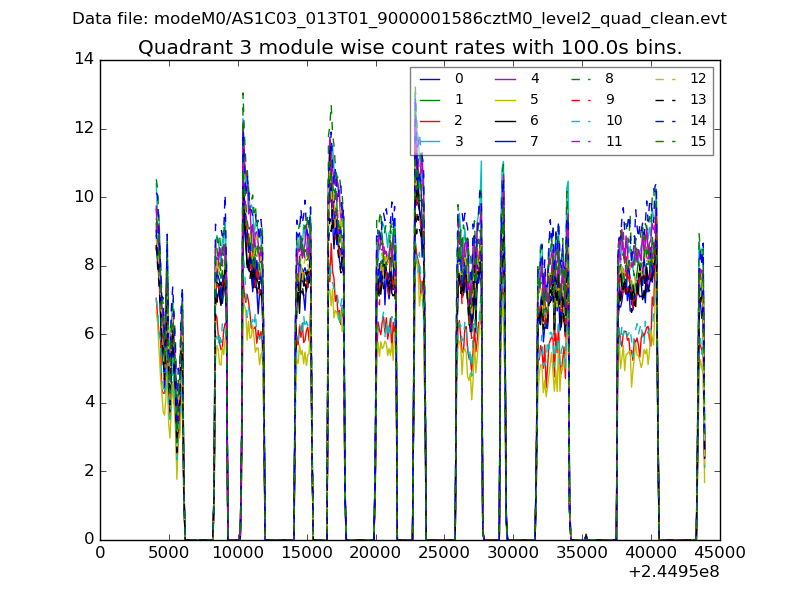
| Module-wise count rates for Quadrant C Data is divided into 100 sec bins |
 |
 |
| Module-wise count rates for Quadrant D Data is divided into 100 sec bins |
 |
 |
| Parameter | Plot |
|---|---|
| CZT HV Monitor |  |
| D_VDD |  |
| Temperature 1 |  |
| Veto HV Monitor | 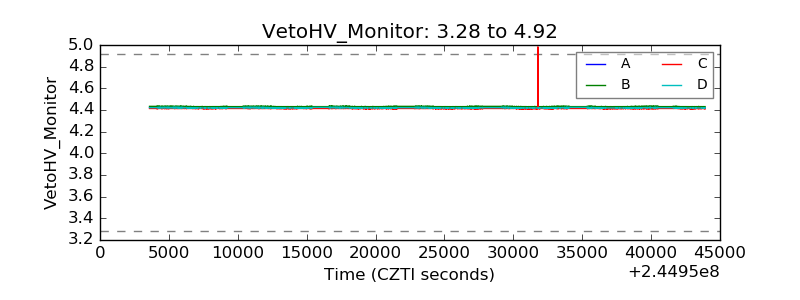 |
| Veto LLD | 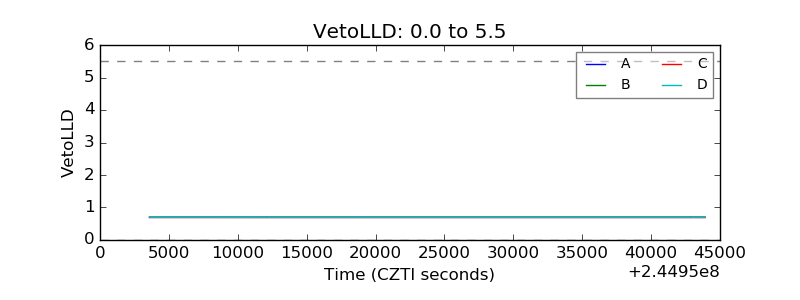 |
| Alpha Counter |  |
| _CPM_Rate |  |
| CZT Counter |  |
| +2.5 Volts monitor |  |
| +5 Volts monitor |  |
| _ROLL_ROT |  |
| _Roll_DEC |  |
| _Roll_RA |  |
| Veto Counter | 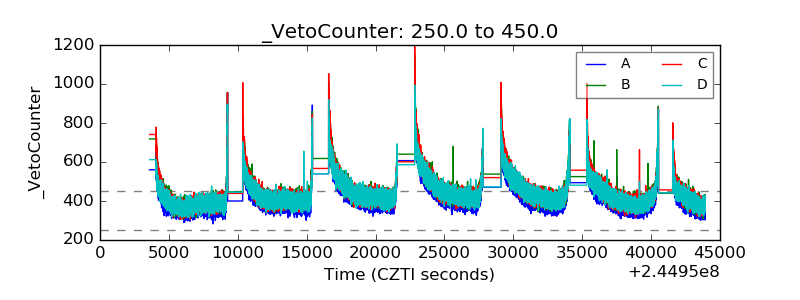 |