| Param | Original file | Final file |
|---|---|---|
| Filename | modeM0/AS1G08_068T01_9000001580cztM0_level2.evt | modeM0/AS1G08_068T01_9000001580cztM0_level2_quad_clean.evt |
| Size (bytes) | 1,170,984,960 | 229,207,680 |
| Size | 1.1 GB | 218.6 MB |
| Events in quadrant A | 10,252,676 | 1,490,249 |
| Events in quadrant B | 8,961,771 | 1,547,577 |
| Events in quadrant C | 6,688,151 | 1,528,395 |
| Events in quadrant D | 8,629,441 | 1,423,556 |
| Mode M0 | |||
|---|---|---|---|
| Quadrant | BADHDUFLAG | Total packets | Discarded packets |
| A | 0 | 39775 | 0 |
| B | 0 | 35519 | 0 |
| C | 0 | 29007 | 0 |
| D | 0 | 34372 | 0 |
| Mode SS | |||
|---|---|---|---|
| Quadrant | BADHDUFLAG | Total packets | Discarded packets |
| A | 0 | 280 | 0 |
| B | 0 | 282 | 0 |
| C | 0 | 282 | 0 |
| D | 0 | 282 | 0 |
| Mode M9 | |||
|---|---|---|---|
| Quadrant | BADHDUFLAG | Total packets | Discarded packets |
| A | 0 | 38 | 0 |
| B | 0 | 38 | 0 |
| C | 0 | 38 | 0 |
| D | 0 | 38 | 0 |
| Quadrant | Total seconds | Saturated seconds | Saturation percentage |
|---|---|---|---|
| A | 13796 | 1129 | 8.183531% |
| B | 13796 | 664 | 4.812989% |
| C | 13800 | 132 | 0.956522% |
| D | 13795 | 520 | 3.769482% |
Noise dominated data is calculated using 1-second bins in cleaned event files. If a bin has >2000 counts, and if more than 50% of those come from <1% of pixels, then it is considered to be noise-dominated and hence unusable.
| Quadrant | # 1 sec bins | Bins with >0 counts | Bins with >2000 counts | High rate bins dominated by noise | Noise dominated (total time) | Noise dominated (detector-on time) | Marked lightcurve |
|---|---|---|---|---|---|---|---|
| A | 17608 | 13809 | 724 | 724 | 4.11% | 5.24% |  |
| B | 17608 | 13811 | 270 | 270 | 1.53% | 1.95% | 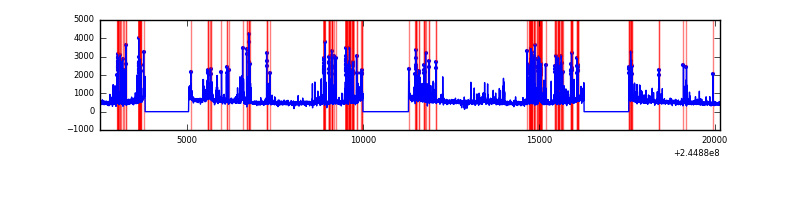 |
| C | 17608 | 13811 | 1 | 1 | 0.01% | 0.01% |  |
| D | 17608 | 13809 | 329 | 329 | 1.87% | 2.38% |  |
Top three noisy pixels from each quadrant. If the there are fewer than three noisy pixels in the level2.evt file, extra rows are filled as -1
| Pixel properties | Quadrant properties | ||||||
|---|---|---|---|---|---|---|---|
| Quadrant | DetID | PixID | Counts | Sigma | Mean | Median | Sigma |
| A | 8 | 5 | 1851223 | 5378.71 | 1734 | 1706 | 343.9 |
| A | 15 | 223 | 1030081 | 2990.69 | 1734 | 1706 | 343.9 |
| A | 15 | 239 | 466452 | 1351.56 | 1734 | 1706 | 343.9 |
| B | 4 | 239 | 1827829 | 5596.04 | 1754 | 1720 | 326.3 |
| B | 15 | 204 | 115278 | 347.99 | 1754 | 1720 | 326.3 |
| B | 11 | 51 | 60857 | 181.22 | 1754 | 1720 | 326.3 |
| C | 13 | 61 | 12826 | 28.67 | 1708 | 1722 | 387.3 |
| C | 12 | 4 | 10051 | 21.5 | 1708 | 1722 | 387.3 |
| C | 14 | 234 | 8907 | 18.55 | 1708 | 1722 | 387.3 |
| D | 13 | 152 | 1016095 | 2527.92 | 1692 | 1651 | 401.3 |
| D | 8 | 195 | 414168 | 1027.96 | 1692 | 1651 | 401.3 |
| D | 13 | 104 | 178296 | 440.19 | 1692 | 1651 | 401.3 |
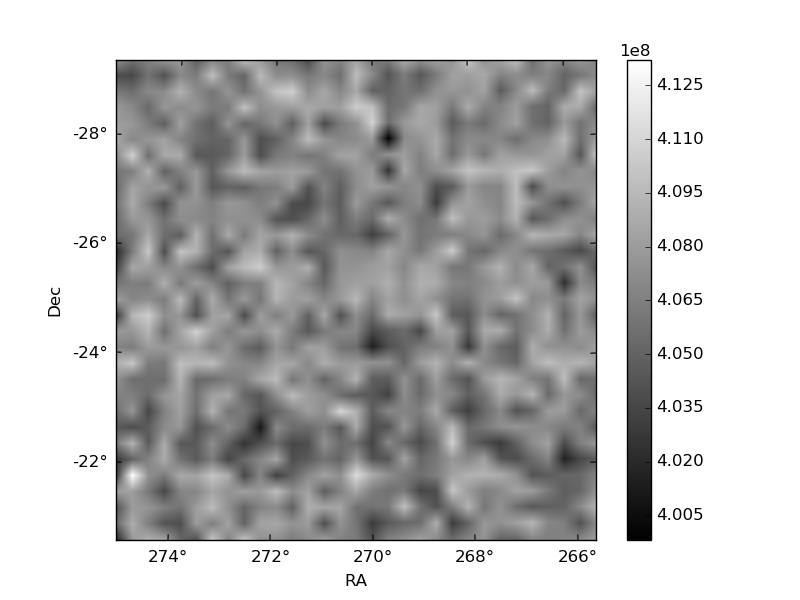
Histogram calculated using DETX and DETY for each event in the final _common_clean file
| Quadrant A |  |
 |
Quadrant B |
|---|---|---|---|
| Quadrant D |  |
 |
Quadrant C |
| Plot type | Count rate plots | Images |
|---|---|---|
| Comparison with Poisson distribution Blue bars denote a histogram of data divided into 1 sec bins. Red curve is a Poisson curve with rate = median count rate of data. |
 |
 |
| Quadrant-wise count rates Data is divided into 100 sec bins |
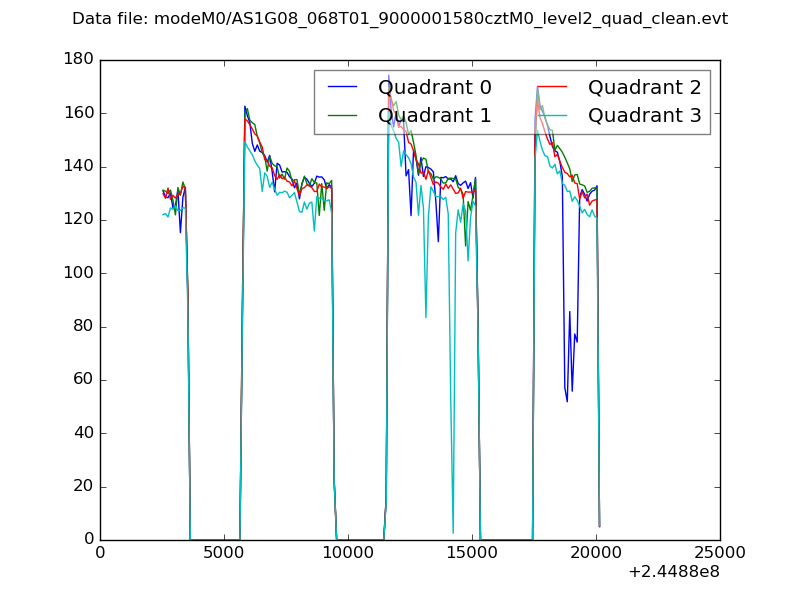 |
|
| Module-wise count rates for Quadrant A Data is divided into 100 sec bins |
 |
 |
| Module-wise count rates for Quadrant B Data is divided into 100 sec bins |
 |
 |
| Module-wise count rates for Quadrant C Data is divided into 100 sec bins |
 |
 |
| Module-wise count rates for Quadrant D Data is divided into 100 sec bins |
 |
 |
| Parameter | Plot |
|---|---|
| CZT HV Monitor |  |
| D_VDD |  |
| Temperature 1 |  |
| Veto HV Monitor | 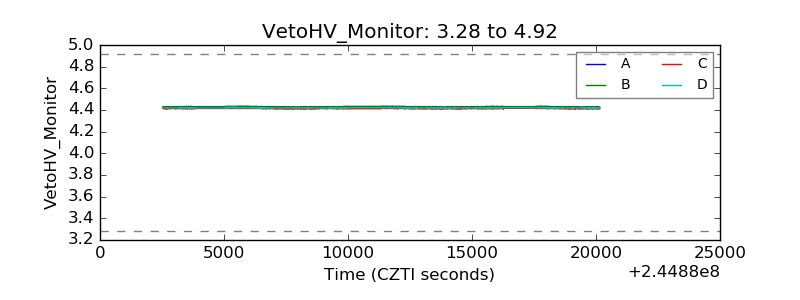 |
| Veto LLD |  |
| Alpha Counter |  |
| _CPM_Rate |  |
| CZT Counter |  |
| +2.5 Volts monitor |  |
| +5 Volts monitor |  |
| _ROLL_ROT |  |
| _Roll_DEC |  |
| _Roll_RA |  |
| Veto Counter |  |