| Param | Original file | Final file |
|---|---|---|
| Filename | modeM0/AS1A04_109T01_9000001578cztM0_level2.evt | modeM0/AS1A04_109T01_9000001578cztM0_level2_quad_clean.evt |
| Size (bytes) | 4,048,562,880 | 689,829,120 |
| Size | 3.8 GB | 657.9 MB |
| Events in quadrant A | 36,621,555 | 4,248,246 |
| Events in quadrant B | 31,951,116 | 4,414,185 |
| Events in quadrant C | 22,917,696 | 4,472,531 |
| Events in quadrant D | 27,657,306 | 4,231,550 |
| Mode M9 | |||
|---|---|---|---|
| Quadrant | BADHDUFLAG | Total packets | Discarded packets |
| A | 0 | 58 | 0 |
| B | 0 | 58 | 0 |
| C | 0 | 58 | 0 |
| D | 0 | 58 | 0 |
| Mode SS | |||
|---|---|---|---|
| Quadrant | BADHDUFLAG | Total packets | Discarded packets |
| A | 0 | 1046 | 0 |
| B | 0 | 1046 | 0 |
| C | 0 | 1048 | 0 |
| D | 0 | 1048 | 0 |
| Mode M0 | |||
|---|---|---|---|
| Quadrant | BADHDUFLAG | Total packets | Discarded packets |
| A | 0 | 143260 | 0 |
| B | 0 | 128871 | 0 |
| C | 0 | 104792 | 0 |
| D | 0 | 117725 | 0 |
| Quadrant | Total seconds | Saturated seconds | Saturation percentage |
|---|---|---|---|
| A | 51394 | 3331 | 6.481301% |
| B | 51401 | 2246 | 4.369565% |
| C | 51392 | 261 | 0.507861% |
| D | 51396 | 841 | 1.636314% |
Noise dominated data is calculated using 1-second bins in cleaned event files. If a bin has >2000 counts, and if more than 50% of those come from <1% of pixels, then it is considered to be noise-dominated and hence unusable.
| Quadrant | # 1 sec bins | Bins with >0 counts | Bins with >2000 counts | High rate bins dominated by noise | Noise dominated (total time) | Noise dominated (detector-on time) | Marked lightcurve |
|---|---|---|---|---|---|---|---|
| A | 57336 | 51424 | 2153 | 2153 | 3.76% | 4.19% |  |
| B | 57336 | 51424 | 1147 | 1147 | 2.00% | 2.23% |  |
| C | 57336 | 51424 | 0 | 0 | 0.00% | 0.00% |  |
| D | 57336 | 51423 | 483 | 483 | 0.84% | 0.94% |  |
Top three noisy pixels from each quadrant. If the there are fewer than three noisy pixels in the level2.evt file, extra rows are filled as -1
| Pixel properties | Quadrant properties | ||||||
|---|---|---|---|---|---|---|---|
| Quadrant | DetID | PixID | Counts | Sigma | Mean | Median | Sigma |
| A | 8 | 5 | 6048362 | 5134.04 | 5873 | 5746 | 1177.0 |
| A | 13 | 251 | 4803294 | 4076.18 | 5873 | 5746 | 1177.0 |
| A | 15 | 223 | 1444848 | 1222.72 | 5873 | 5746 | 1177.0 |
| B | 4 | 239 | 7737314 | 6830.44 | 5991 | 5833 | 1131.9 |
| B | 0 | 214 | 319134 | 276.79 | 5991 | 5833 | 1131.9 |
| B | 0 | 219 | 142428 | 120.68 | 5991 | 5833 | 1131.9 |
| C | 13 | 61 | 43696 | 27.9 | 5865 | 5894 | 1354.7 |
| C | 8 | 222 | 32986 | 20.0 | 5865 | 5894 | 1354.7 |
| C | 0 | 207 | 21688 | 11.66 | 5865 | 5894 | 1354.7 |
| D | 1 | 52 | 2914794 | 2073.82 | 5823 | 5645 | 1402.8 |
| D | 5 | 222 | 636342 | 449.6 | 5823 | 5645 | 1402.8 |
| D | 8 | 195 | 501134 | 353.21 | 5823 | 5645 | 1402.8 |
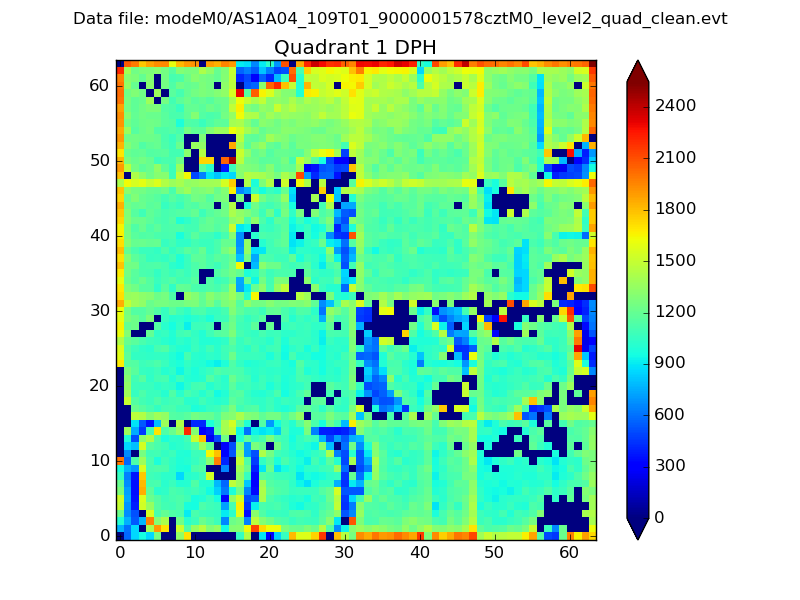
Histogram calculated using DETX and DETY for each event in the final _common_clean file
| Quadrant A |  |
 |
Quadrant B |
|---|---|---|---|
| Quadrant D |  |
 |
Quadrant C |
| Plot type | Count rate plots | Images |
|---|---|---|
| Comparison with Poisson distribution Blue bars denote a histogram of data divided into 1 sec bins. Red curve is a Poisson curve with rate = median count rate of data. |
 |
 |
| Quadrant-wise count rates Data is divided into 100 sec bins |
 |
|
| Module-wise count rates for Quadrant A Data is divided into 100 sec bins |
 |
 |
| Module-wise count rates for Quadrant B Data is divided into 100 sec bins |
 |
 |
| Module-wise count rates for Quadrant C Data is divided into 100 sec bins |
 |
 |
| Module-wise count rates for Quadrant D Data is divided into 100 sec bins |
 |
 |
| Parameter | Plot |
|---|---|
| CZT HV Monitor |  |
| D_VDD |  |
| Temperature 1 | 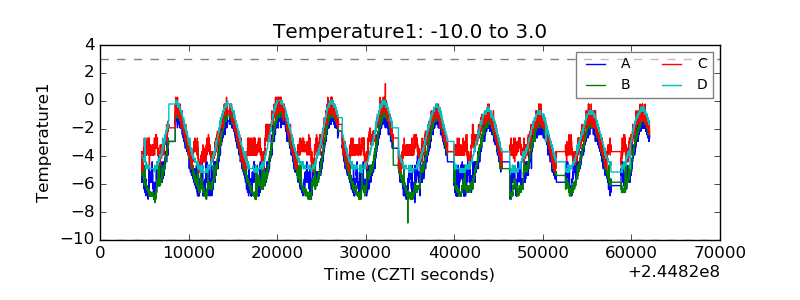 |
| Veto HV Monitor |  |
| Veto LLD |  |
| Alpha Counter |  |
| _CPM_Rate |  |
| CZT Counter |  |
| +2.5 Volts monitor |  |
| +5 Volts monitor |  |
| _ROLL_ROT |  |
| _Roll_DEC |  |
| _Roll_RA |  |
| Veto Counter | 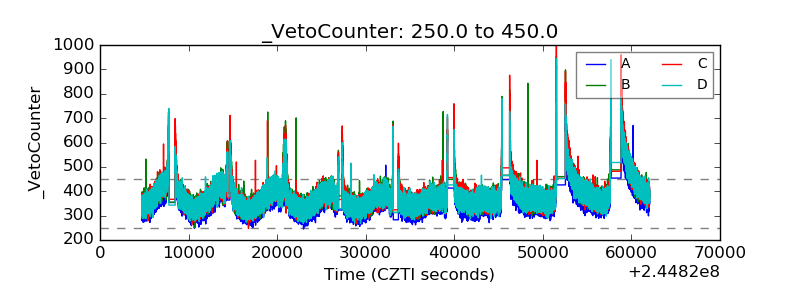 |