| Param | Original file | Final file |
|---|---|---|
| Filename | modeM0/AS1A04_055T02_9000001576cztM0_level2.evt | modeM0/AS1A04_055T02_9000001576cztM0_level2_quad_clean.evt |
| Size (bytes) | 7,699,176,000 | 1,204,182,720 |
| Size | 7.2 GB | 1.1 GB |
| Events in quadrant A | 64,113,915 | 7,574,867 |
| Events in quadrant B | 63,781,173 | 7,689,221 |
| Events in quadrant C | 40,997,587 | 7,798,988 |
| Events in quadrant D | 58,230,314 | 7,247,466 |
| Mode SS | |||
|---|---|---|---|
| Quadrant | BADHDUFLAG | Total packets | Discarded packets |
| A | 0 | 1832 | 0 |
| B | 0 | 1832 | 0 |
| C | 0 | 1832 | 0 |
| D | 0 | 1832 | 0 |
| Mode M0 | |||
|---|---|---|---|
| Quadrant | BADHDUFLAG | Total packets | Discarded packets |
| A | 0 | 249335 | 0 |
| B | 0 | 249006 | 0 |
| C | 0 | 185013 | 0 |
| D | 0 | 234407 | 0 |
| Mode M9 | |||
|---|---|---|---|
| Quadrant | BADHDUFLAG | Total packets | Discarded packets |
| A | 0 | 155 | 0 |
| B | 0 | 155 | 0 |
| C | 0 | 155 | 0 |
| D | 0 | 155 | 0 |
| Quadrant | Total seconds | Saturated seconds | Saturation percentage |
|---|---|---|---|
| A | 89874 | 6181 | 6.877406% |
| B | 89875 | 6221 | 6.921836% |
| C | 89875 | 658 | 0.732128% |
| D | 89874 | 4527 | 5.037052% |
Noise dominated data is calculated using 1-second bins in cleaned event files. If a bin has >2000 counts, and if more than 50% of those come from <1% of pixels, then it is considered to be noise-dominated and hence unusable.
| Quadrant | # 1 sec bins | Bins with >0 counts | Bins with >2000 counts | High rate bins dominated by noise | Noise dominated (total time) | Noise dominated (detector-on time) | Marked lightcurve |
|---|---|---|---|---|---|---|---|
| A | 105410 | 89889 | 3834 | 3834 | 3.64% | 4.27% |  |
| B | 105410 | 89890 | 3434 | 3434 | 3.26% | 3.82% |  |
| C | 105410 | 89891 | 7 | 7 | 0.01% | 0.01% |  |
| D | 105410 | 89890 | 3590 | 3590 | 3.41% | 3.99% |  |
Top three noisy pixels from each quadrant. If the there are fewer than three noisy pixels in the level2.evt file, extra rows are filled as -1
| Pixel properties | Quadrant properties | ||||||
|---|---|---|---|---|---|---|---|
| Quadrant | DetID | PixID | Counts | Sigma | Mean | Median | Sigma |
| A | 8 | 5 | 15511815 | 7292.64 | 10624 | 10425 | 2125.6 |
| A | 13 | 251 | 6385116 | 2998.98 | 10624 | 10425 | 2125.6 |
| A | 15 | 223 | 316633 | 144.06 | 10624 | 10425 | 2125.6 |
| B | 4 | 239 | 19323888 | 9646.26 | 10690 | 10449 | 2002.2 |
| B | 10 | 245 | 988082 | 488.29 | 10690 | 10449 | 2002.2 |
| B | 0 | 214 | 544885 | 266.93 | 10690 | 10449 | 2002.2 |
| C | 13 | 61 | 78098 | 28.15 | 10481 | 10532 | 2400.0 |
| C | 14 | 234 | 63371 | 22.02 | 10481 | 10532 | 2400.0 |
| C | 8 | 222 | 40154 | 12.34 | 10481 | 10532 | 2400.0 |
| D | 13 | 152 | 6411699 | 2573.17 | 10320 | 10040 | 2487.8 |
| D | 1 | 52 | 2877041 | 1152.4 | 10320 | 10040 | 2487.8 |
| D | 12 | 33 | 2448216 | 980.03 | 10320 | 10040 | 2487.8 |
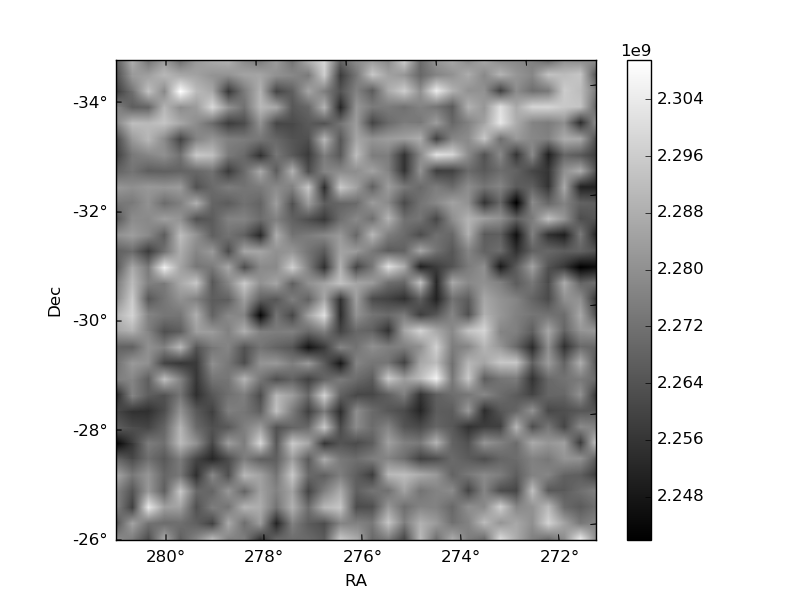
Histogram calculated using DETX and DETY for each event in the final _common_clean file
| Quadrant A |  |
 |
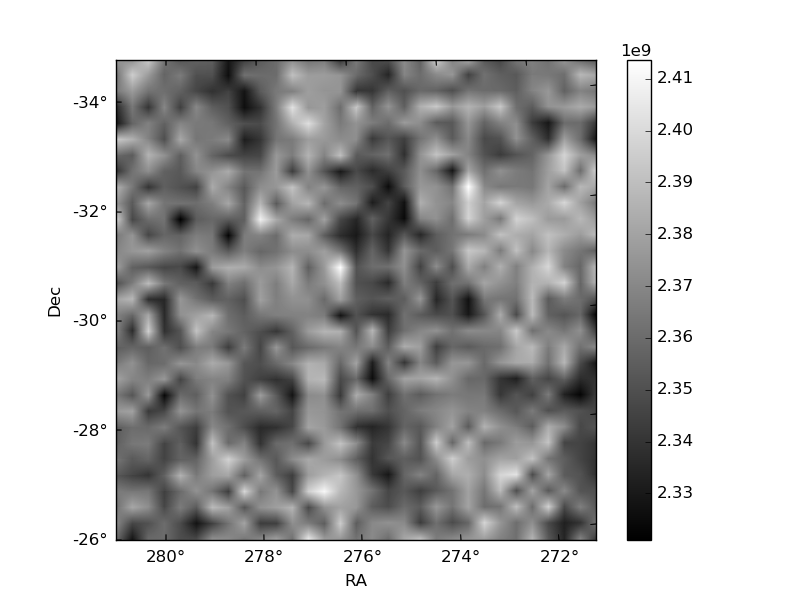
Quadrant B |
|---|---|---|---|
| Quadrant D |  |
 |
Quadrant C |
| Plot type | Count rate plots | Images |
|---|---|---|
| Comparison with Poisson distribution Blue bars denote a histogram of data divided into 1 sec bins. Red curve is a Poisson curve with rate = median count rate of data. |
 |
 |
| Quadrant-wise count rates Data is divided into 100 sec bins |
 |
|
| Module-wise count rates for Quadrant A Data is divided into 100 sec bins |
 |
 |
| Module-wise count rates for Quadrant B Data is divided into 100 sec bins |
 |
 |
| Module-wise count rates for Quadrant C Data is divided into 100 sec bins |
 |
 |
| Module-wise count rates for Quadrant D Data is divided into 100 sec bins |
 |
 |
| Parameter | Plot |
|---|---|
| CZT HV Monitor |  |
| D_VDD |  |
| Temperature 1 | 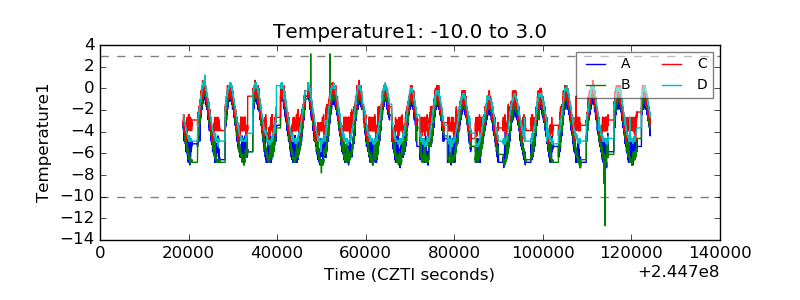 |
| Veto HV Monitor |  |
| Veto LLD |  |
| Alpha Counter | 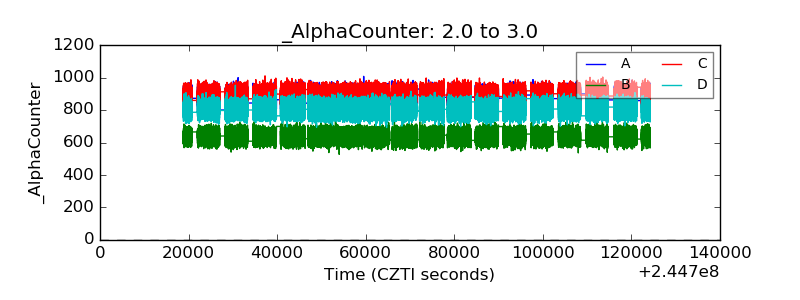 |
| _CPM_Rate |  |
| CZT Counter | 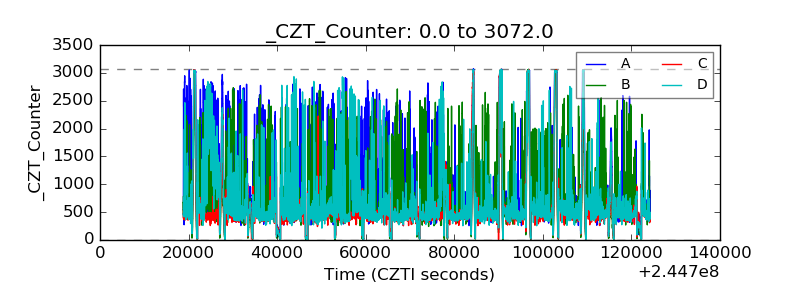 |
| +2.5 Volts monitor | 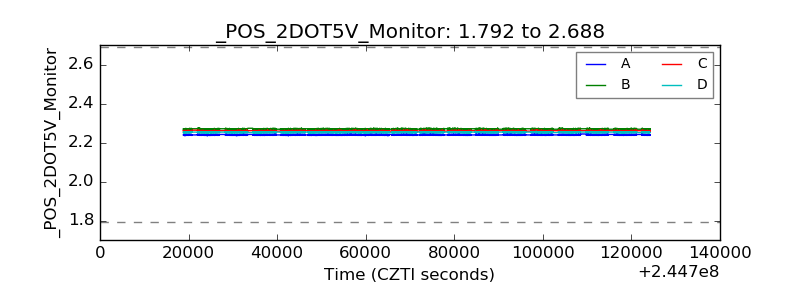 |
| +5 Volts monitor |  |
| _ROLL_ROT |  |
| _Roll_DEC | 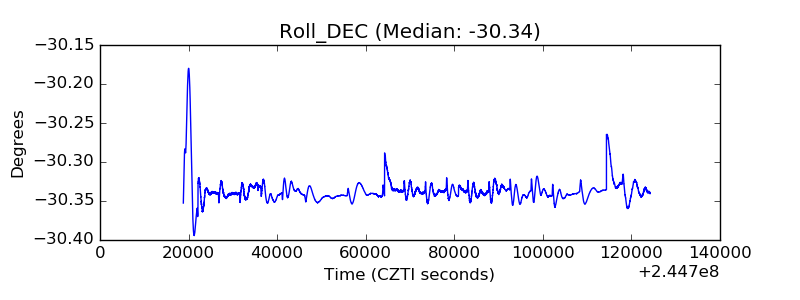 |
| _Roll_RA |  |
| Veto Counter |  |