| Param | Original file | Final file |
|---|---|---|
| Filename | modeM0/AS1A04_055T01_9000001574cztM0_level2.evt | modeM0/AS1A04_055T01_9000001574cztM0_level2_quad_clean.evt |
| Size (bytes) | 6,974,144,640 | 1,221,456,960 |
| Size | 6.5 GB | 1.1 GB |
| Events in quadrant A | 59,805,838 | 7,678,079 |
| Events in quadrant B | 56,554,463 | 7,869,247 |
| Events in quadrant C | 38,263,990 | 8,115,423 |
| Events in quadrant D | 50,971,674 | 7,612,373 |
| Mode M9 | |||
|---|---|---|---|
| Quadrant | BADHDUFLAG | Total packets | Discarded packets |
| A | 0 | 133 | 0 |
| B | 0 | 133 | 0 |
| C | 0 | 133 | 0 |
| D | 0 | 133 | 0 |
| Mode SS | |||
|---|---|---|---|
| Quadrant | BADHDUFLAG | Total packets | Discarded packets |
| A | 0 | 1702 | 0 |
| B | 0 | 1702 | 0 |
| C | 0 | 1702 | 0 |
| D | 0 | 1702 | 0 |
| Mode M0 | |||
|---|---|---|---|
| Quadrant | BADHDUFLAG | Total packets | Discarded packets |
| A | 0 | 233234 | 0 |
| B | 0 | 223787 | 0 |
| C | 0 | 173560 | 0 |
| D | 0 | 207827 | 0 |
| Quadrant | Total seconds | Saturated seconds | Saturation percentage |
|---|---|---|---|
| A | 83427 | 5977 | 7.164347% |
| B | 83427 | 5588 | 6.698071% |
| C | 83427 | 754 | 0.903784% |
| D | 83427 | 2844 | 3.408968% |
Noise dominated data is calculated using 1-second bins in cleaned event files. If a bin has >2000 counts, and if more than 50% of those come from <1% of pixels, then it is considered to be noise-dominated and hence unusable.
| Quadrant | # 1 sec bins | Bins with >0 counts | Bins with >2000 counts | High rate bins dominated by noise | Noise dominated (total time) | Noise dominated (detector-on time) | Marked lightcurve |
|---|---|---|---|---|---|---|---|
| A | 96587 | 83438 | 3736 | 3736 | 3.87% | 4.48% |  |
| B | 96588 | 83440 | 3162 | 3162 | 3.27% | 3.79% |  |
| C | 96588 | 83442 | 175 | 175 | 0.18% | 0.21% | 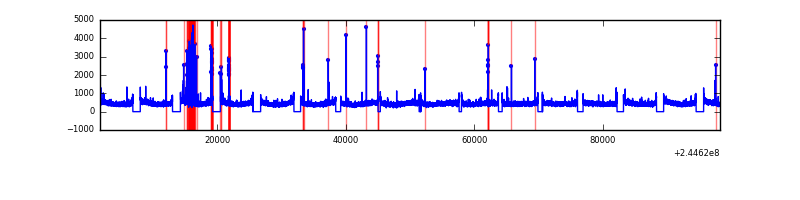 |
| D | 96588 | 83440 | 1727 | 1727 | 1.79% | 2.07% |  |
Top three noisy pixels from each quadrant. If the there are fewer than three noisy pixels in the level2.evt file, extra rows are filled as -1
| Pixel properties | Quadrant properties | ||||||
|---|---|---|---|---|---|---|---|
| Quadrant | DetID | PixID | Counts | Sigma | Mean | Median | Sigma |
| A | 8 | 5 | 20854474 | 10808.36 | 9600 | 9412 | 1928.6 |
| A | 5 | 16 | 694752 | 355.36 | 9600 | 9412 | 1928.6 |
| A | 15 | 223 | 535964 | 273.02 | 9600 | 9412 | 1928.6 |
| B | 4 | 239 | 17084725 | 9520.26 | 9666 | 9448 | 1793.6 |
| B | 0 | 214 | 446854 | 243.87 | 9666 | 9448 | 1793.6 |
| B | 0 | 219 | 428750 | 233.78 | 9666 | 9448 | 1793.6 |
| C | 4 | 254 | 779335 | 352.19 | 9546 | 9582 | 2185.6 |
| C | 0 | 207 | 112815 | 47.23 | 9546 | 9582 | 2185.6 |
| C | 14 | 234 | 104915 | 43.62 | 9546 | 9582 | 2185.6 |
| D | 1 | 52 | 6465608 | 2849.58 | 9463 | 9195 | 2265.7 |
| D | 8 | 195 | 2220812 | 976.11 | 9463 | 9195 | 2265.7 |
| D | 10 | 199 | 1278714 | 560.31 | 9463 | 9195 | 2265.7 |
Histogram calculated using DETX and DETY for each event in the final _common_clean file
| Quadrant A |  |
 |
Quadrant B |
|---|---|---|---|
| Quadrant D | 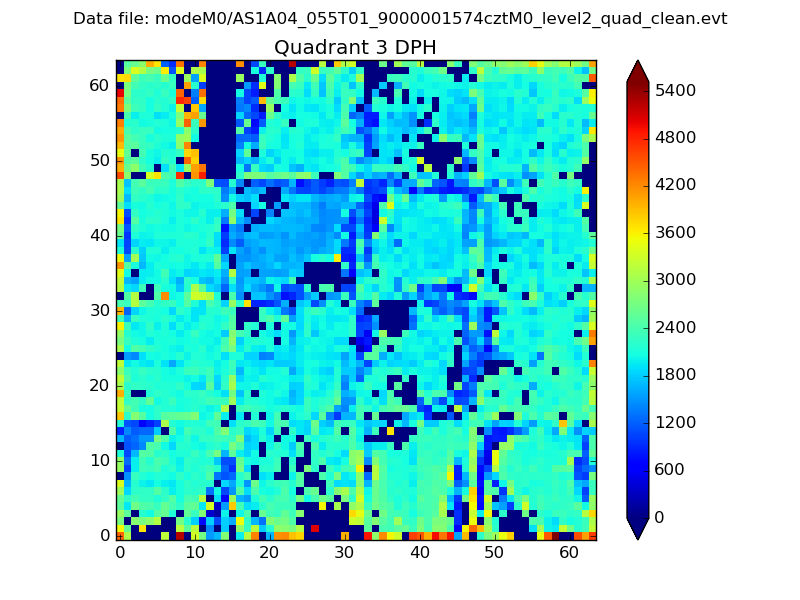 |
 |
Quadrant C |
| Plot type | Count rate plots | Images |
|---|---|---|
| Comparison with Poisson distribution Blue bars denote a histogram of data divided into 1 sec bins. Red curve is a Poisson curve with rate = median count rate of data. |
 |
 |
| Quadrant-wise count rates Data is divided into 100 sec bins |
 |
|
| Module-wise count rates for Quadrant A Data is divided into 100 sec bins |
 |
 |
| Module-wise count rates for Quadrant B Data is divided into 100 sec bins |
 |
 |
| Module-wise count rates for Quadrant C Data is divided into 100 sec bins |
 |
 |
| Module-wise count rates for Quadrant D Data is divided into 100 sec bins |
 |
 |
| Parameter | Plot |
|---|---|
| CZT HV Monitor |  |
| D_VDD | 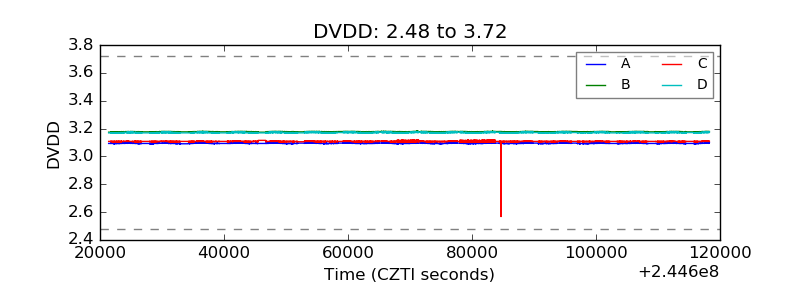 |
| Temperature 1 | 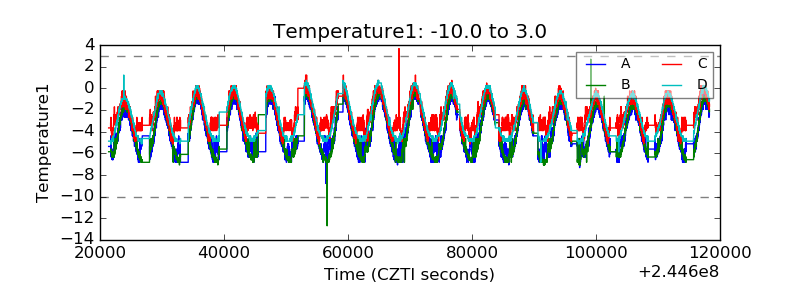 |
| Veto HV Monitor |  |
| Veto LLD |  |
| Alpha Counter |  |
| _CPM_Rate |  |
| CZT Counter |  |
| +2.5 Volts monitor |  |
| +5 Volts monitor |  |
| _ROLL_ROT |  |
| _Roll_DEC |  |
| _Roll_RA |  |
| Veto Counter |  |