| Param | Original file | Final file |
|---|---|---|
| Filename | modeM0/AS1G07_053T01_9000001566cztM0_level2.evt | modeM0/AS1G07_053T01_9000001566cztM0_level2_quad_clean.evt |
| Size (bytes) | 2,587,700,160 | 303,747,840 |
| Size | 2.4 GB | 289.7 MB |
| Events in quadrant A | 25,815,686 | 1,728,422 |
| Events in quadrant B | 20,050,161 | 1,959,689 |
| Events in quadrant C | 11,648,479 | 1,980,254 |
| Events in quadrant D | 19,158,852 | 1,794,747 |
| Mode SS | |||
|---|---|---|---|
| Quadrant | BADHDUFLAG | Total packets | Discarded packets |
| A | 0 | 512 | 0 |
| B | 0 | 510 | 0 |
| C | 0 | 512 | 0 |
| D | 0 | 512 | 0 |
| Mode M9 | |||
|---|---|---|---|
| Quadrant | BADHDUFLAG | Total packets | Discarded packets |
| A | 0 | 55 | 0 |
| B | 0 | 55 | 0 |
| C | 0 | 55 | 0 |
| D | 0 | 55 | 0 |
| Mode M0 | |||
|---|---|---|---|
| Quadrant | BADHDUFLAG | Total packets | Discarded packets |
| A | 0 | 94046 | 0 |
| B | 0 | 76659 | 0 |
| C | 0 | 52542 | 0 |
| D | 0 | 74330 | 0 |
| Quadrant | Total seconds | Saturated seconds | Saturation percentage |
|---|---|---|---|
| A | 25221 | 5121 | 20.304508% |
| B | 25223 | 2328 | 9.229671% |
| C | 25227 | 198 | 0.784873% |
| D | 25225 | 1699 | 6.735382% |
Noise dominated data is calculated using 1-second bins in cleaned event files. If a bin has >2000 counts, and if more than 50% of those come from <1% of pixels, then it is considered to be noise-dominated and hence unusable.
| Quadrant | # 1 sec bins | Bins with >0 counts | Bins with >2000 counts | High rate bins dominated by noise | Noise dominated (total time) | Noise dominated (detector-on time) | Marked lightcurve |
|---|---|---|---|---|---|---|---|
| A | 30597 | 25231 | 3413 | 3413 | 11.15% | 13.53% |  |
| B | 30597 | 25232 | 1366 | 1366 | 4.46% | 5.41% |  |
| C | 30597 | 25233 | 29 | 29 | 0.09% | 0.11% |  |
| D | 30597 | 25233 | 1351 | 1351 | 4.42% | 5.35% |  |
Top three noisy pixels from each quadrant. If the there are fewer than three noisy pixels in the level2.evt file, extra rows are filled as -1
| Pixel properties | Quadrant properties | ||||||
|---|---|---|---|---|---|---|---|
| Quadrant | DetID | PixID | Counts | Sigma | Mean | Median | Sigma |
| A | 8 | 5 | 14669699 | 26784.5 | 2732 | 2681 | 547.6 |
| A | 4 | 2 | 335924 | 608.56 | 2732 | 2681 | 547.6 |
| A | 15 | 174 | 108703 | 193.61 | 2732 | 2681 | 547.6 |
| B | 4 | 239 | 5871882 | 10548.14 | 2974 | 2909 | 556.4 |
| B | 15 | 204 | 913695 | 1636.93 | 2974 | 2909 | 556.4 |
| B | 0 | 85 | 889597 | 1593.62 | 2974 | 2909 | 556.4 |
| C | 14 | 234 | 153693 | 223.24 | 2934 | 2952 | 675.2 |
| C | 0 | 207 | 52109 | 72.8 | 2934 | 2952 | 675.2 |
| C | 13 | 61 | 22270 | 28.61 | 2934 | 2952 | 675.2 |
| D | 4 | 95 | 1278975 | 1854.92 | 2849 | 2775 | 688.0 |
| D | 13 | 138 | 1207525 | 1751.07 | 2849 | 2775 | 688.0 |
| D | 1 | 52 | 1096648 | 1589.92 | 2849 | 2775 | 688.0 |
Histogram calculated using DETX and DETY for each event in the final _common_clean file
| Quadrant A | 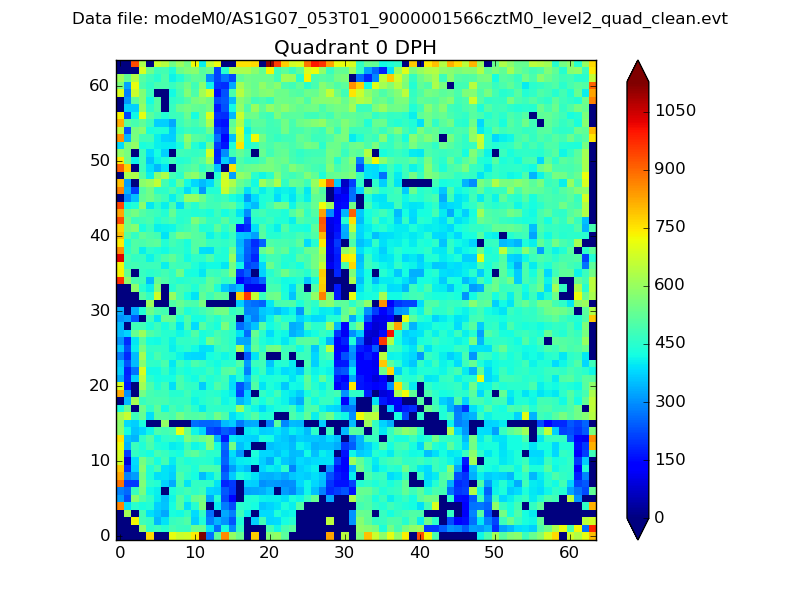 |
 |
Quadrant B |
|---|---|---|---|
| Quadrant D |  |
 |
Quadrant C |
| Plot type | Count rate plots | Images |
|---|---|---|
| Comparison with Poisson distribution Blue bars denote a histogram of data divided into 1 sec bins. Red curve is a Poisson curve with rate = median count rate of data. |
 |
 |
| Quadrant-wise count rates Data is divided into 100 sec bins |
 |
|
| Module-wise count rates for Quadrant A Data is divided into 100 sec bins |
 |
 |
| Module-wise count rates for Quadrant B Data is divided into 100 sec bins |
 |
 |
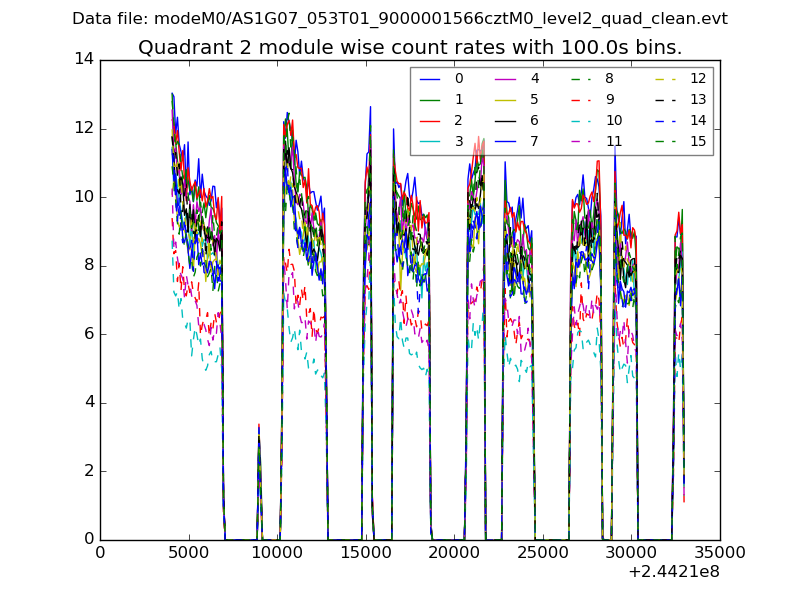
| Module-wise count rates for Quadrant C Data is divided into 100 sec bins |
 |
 |
| Module-wise count rates for Quadrant D Data is divided into 100 sec bins |
 |
 |
| Parameter | Plot |
|---|---|
| CZT HV Monitor | 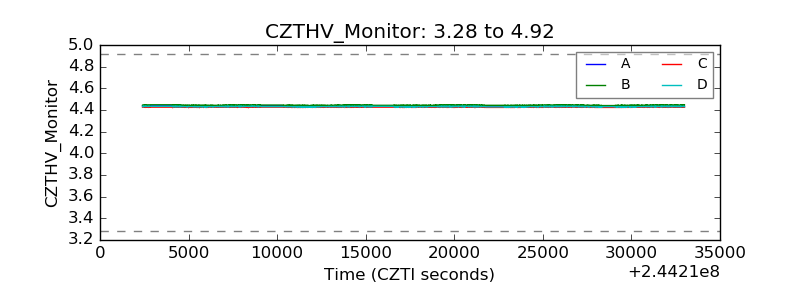 |
| D_VDD |  |
| Temperature 1 |  |
| Veto HV Monitor |  |
| Veto LLD |  |
| Alpha Counter |  |
| _CPM_Rate |  |
| CZT Counter |  |
| +2.5 Volts monitor | 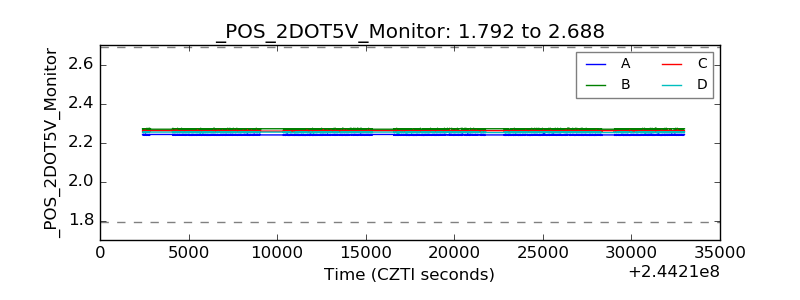 |
| +5 Volts monitor |  |
| _ROLL_ROT | 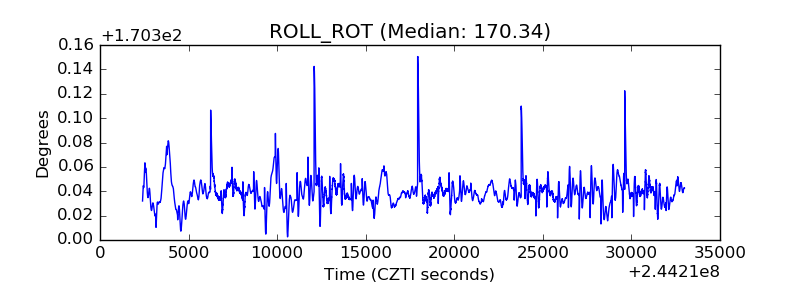 |
| _Roll_DEC |  |
| _Roll_RA | 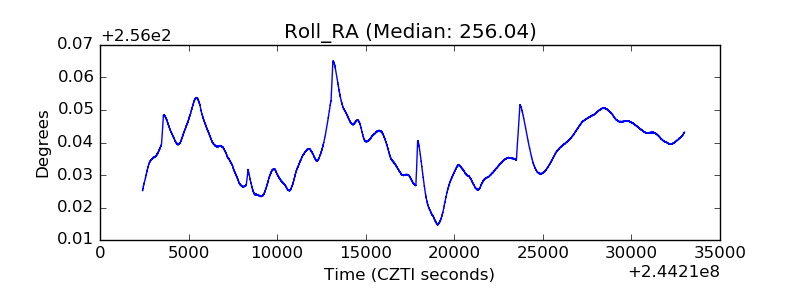 |
| Veto Counter |  |