| Param | Original file | Final file |
|---|---|---|
| Filename | modeM0/AS1G07_003T02_9000001564cztM0_level2.evt | modeM0/AS1G07_003T02_9000001564cztM0_level2_quad_clean.evt |
| Size (bytes) | 2,727,216,000 | 367,044,480 |
| Size | 2.5 GB | 350.0 MB |
| Events in quadrant A | 26,152,642 | 2,181,470 |
| Events in quadrant B | 21,895,533 | 2,301,907 |
| Events in quadrant C | 13,574,222 | 2,361,989 |
| Events in quadrant D | 18,958,227 | 2,213,924 |
| Mode M9 | |||
|---|---|---|---|
| Quadrant | BADHDUFLAG | Total packets | Discarded packets |
| A | 0 | 49 | 0 |
| B | 0 | 49 | 0 |
| C | 0 | 49 | 0 |
| D | 0 | 49 | 0 |
| Mode M0 | |||
|---|---|---|---|
| Quadrant | BADHDUFLAG | Total packets | Discarded packets |
| A | 0 | 97659 | 0 |
| B | 0 | 84748 | 0 |
| C | 0 | 61629 | 0 |
| D | 0 | 76688 | 0 |
| Mode SS | |||
|---|---|---|---|
| Quadrant | BADHDUFLAG | Total packets | Discarded packets |
| A | 0 | 606 | 0 |
| B | 0 | 606 | 0 |
| C | 0 | 606 | 0 |
| D | 0 | 606 | 0 |
| Quadrant | Total seconds | Saturated seconds | Saturation percentage |
|---|---|---|---|
| A | 29918 | 3659 | 12.230096% |
| B | 29920 | 2342 | 7.827540% |
| C | 29920 | 238 | 0.795455% |
| D | 29920 | 1132 | 3.783422% |
Noise dominated data is calculated using 1-second bins in cleaned event files. If a bin has >2000 counts, and if more than 50% of those come from <1% of pixels, then it is considered to be noise-dominated and hence unusable.
| Quadrant | # 1 sec bins | Bins with >0 counts | Bins with >2000 counts | High rate bins dominated by noise | Noise dominated (total time) | Noise dominated (detector-on time) | Marked lightcurve |
|---|---|---|---|---|---|---|---|
| A | 34676 | 29923 | 2621 | 2621 | 7.56% | 8.76% |  |
| B | 34676 | 29923 | 1327 | 1327 | 3.83% | 4.43% | 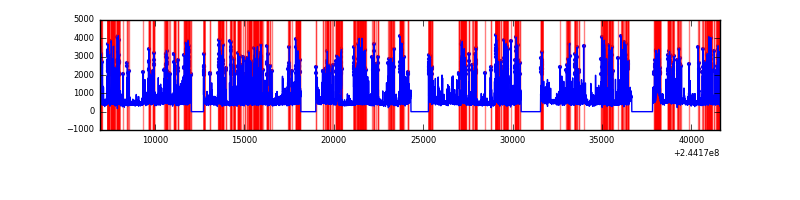 |
| C | 34676 | 29925 | 19 | 19 | 0.05% | 0.06% |  |
| D | 34676 | 29924 | 830 | 830 | 2.39% | 2.77% |  |
Top three noisy pixels from each quadrant. If the there are fewer than three noisy pixels in the level2.evt file, extra rows are filled as -1
| Pixel properties | Quadrant properties | ||||||
|---|---|---|---|---|---|---|---|
| Quadrant | DetID | PixID | Counts | Sigma | Mean | Median | Sigma |
| A | 8 | 5 | 12896510 | 19272.11 | 3337 | 3269 | 669.0 |
| A | 4 | 2 | 328589 | 486.27 | 3337 | 3269 | 669.0 |
| A | 15 | 174 | 32897 | 44.29 | 3337 | 3269 | 669.0 |
| B | 4 | 239 | 7506381 | 11521.73 | 3450 | 3369 | 651.2 |
| B | 15 | 204 | 565249 | 862.83 | 3450 | 3369 | 651.2 |
| B | 0 | 214 | 186918 | 281.86 | 3450 | 3369 | 651.2 |
| C | 14 | 234 | 183240 | 228.16 | 3427 | 3443 | 788.0 |
| C | 13 | 61 | 25272 | 27.7 | 3427 | 3443 | 788.0 |
| C | 8 | 222 | 18837 | 19.53 | 3427 | 3443 | 788.0 |
| D | 1 | 52 | 1472940 | 1825.8 | 3373 | 3291 | 804.9 |
| D | 12 | 233 | 948767 | 1174.6 | 3373 | 3291 | 804.9 |
| D | 13 | 138 | 914555 | 1132.1 | 3373 | 3291 | 804.9 |
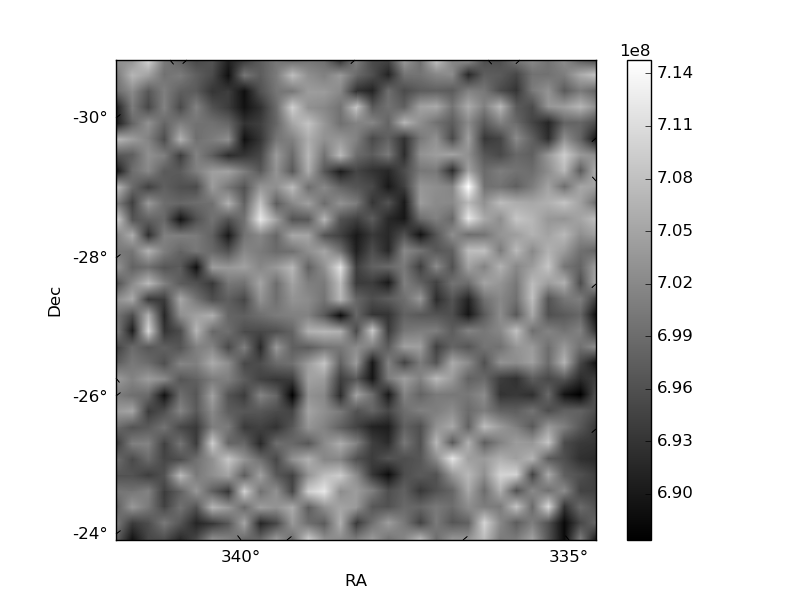
Histogram calculated using DETX and DETY for each event in the final _common_clean file
| Quadrant A |  |
 |
Quadrant B |
|---|---|---|---|
| Quadrant D |  |
 |
Quadrant C |
| Plot type | Count rate plots | Images |
|---|---|---|
| Comparison with Poisson distribution Blue bars denote a histogram of data divided into 1 sec bins. Red curve is a Poisson curve with rate = median count rate of data. |
 |
 |
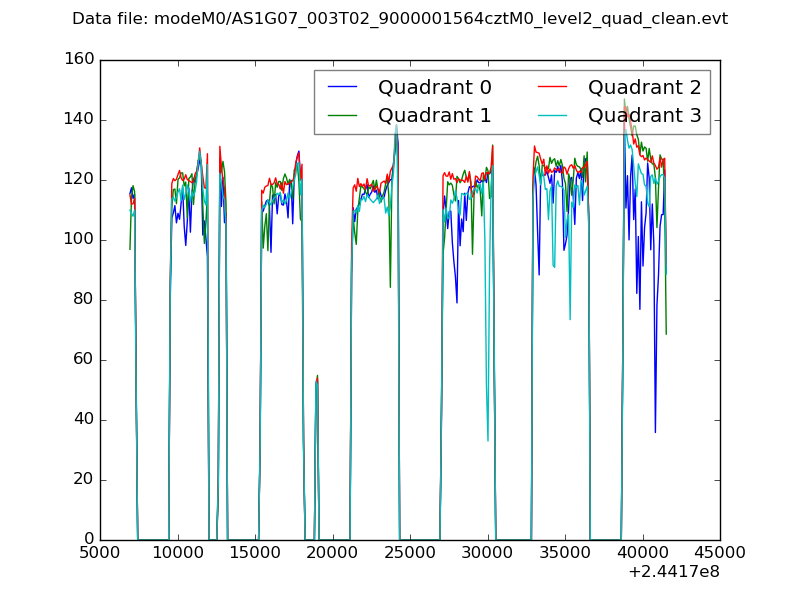
| Quadrant-wise count rates Data is divided into 100 sec bins |
 |
|
| Module-wise count rates for Quadrant A Data is divided into 100 sec bins |
 |
 |
| Module-wise count rates for Quadrant B Data is divided into 100 sec bins |
 |
 |
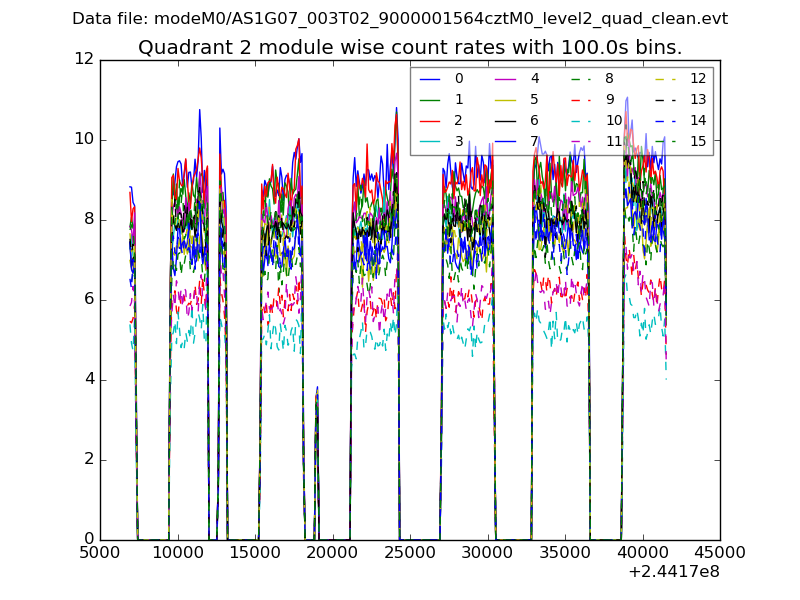
| Module-wise count rates for Quadrant C Data is divided into 100 sec bins |
 |
 |
| Module-wise count rates for Quadrant D Data is divided into 100 sec bins |
 |
 |
| Parameter | Plot |
|---|---|
| CZT HV Monitor |  |
| D_VDD |  |
| Temperature 1 |  |
| Veto HV Monitor |  |
| Veto LLD |  |
| Alpha Counter | 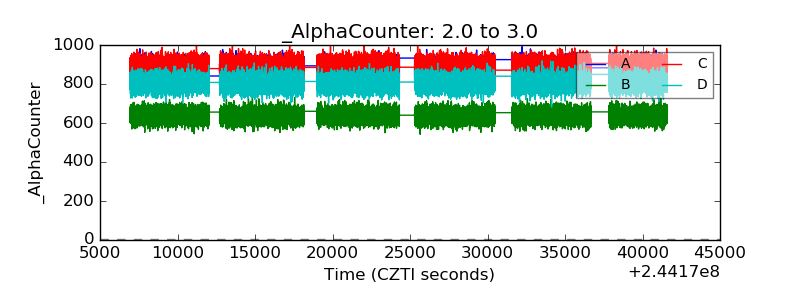 |
| _CPM_Rate |  |
| CZT Counter |  |
| +2.5 Volts monitor |  |
| +5 Volts monitor |  |
| _ROLL_ROT |  |
| _Roll_DEC |  |
| _Roll_RA |  |
| Veto Counter |  |