| Param | Original file | Final file |
|---|---|---|
| Filename | modeM0/AS1A03_086T01_9000001568cztM0_level2_bc.evt | modeM0/AS1A03_086T01_9000001568cztM0_level2_quad_clean.evt |
| Size (bytes) | 10,259,821,440 | 2,683,745,280 |
| Size | 9.6 GB | 2.5 GB |
| Events in quadrant A | 96,238,627 | 16,495,462 |
| Events in quadrant B | 73,852,683 | 17,101,181 |
| Events in quadrant C | 44,539,591 | 17,354,241 |
| Events in quadrant D | 81,975,508 | 16,108,110 |
| Mode M9 | |||
|---|---|---|---|
| Quadrant | BADHDUFLAG | Total packets | Discarded packets |
| A | 0 | 317 | 0 |
| B | 0 | 317 | 0 |
| C | 0 | 317 | 0 |
| D | 0 | 317 | 0 |
| Mode SS | |||
|---|---|---|---|
| Quadrant | BADHDUFLAG | Total packets | Discarded packets |
| A | 0 | 4232 | 0 |
| B | 0 | 4238 | 0 |
| C | 0 | 4234 | 0 |
| D | 0 | 4232 | 0 |
| Mode M0 | |||
|---|---|---|---|
| Quadrant | BADHDUFLAG | Total packets | Discarded packets |
| A | 0 | 654691 | 0 |
| B | 0 | 563042 | 0 |
| C | 0 | 433097 | 0 |
| D | 0 | 558599 | 0 |
| Quadrant | Total seconds | Saturated seconds | Saturation percentage |
|---|---|---|---|
| A | 207578 | 20713 | 9.978418% |
| B | 207651 | 13373 | 6.440133% |
| C | 207732 | 1835 | 0.883350% |
| D | 207628 | 10078 | 4.853873% |
Noise dominated data is calculated using 1-second bins in cleaned event files. If a bin has >2000 counts, and if more than 50% of those come from <1% of pixels, then it is considered to be noise-dominated and hence unusable.
| Quadrant | # 1 sec bins | Bins with >0 counts | Bins with >2000 counts | High rate bins dominated by noise | Noise dominated (total time) | Noise dominated (detector-on time) | Marked lightcurve |
|---|---|---|---|---|---|---|---|
| A | 242018 | 208167 | 2518 | 2518 | 1.04% | 1.21% |  |
| B | 242018 | 208215 | 191 | 191 | 0.08% | 0.09% | 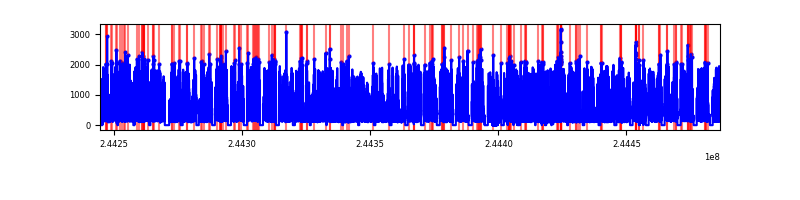 |
| C | 242018 | 208299 | 53 | 53 | 0.02% | 0.03% |  |
| D | 242018 | 208189 | 3514 | 3514 | 1.45% | 1.69% |  |
Top three noisy pixels from each quadrant. If the there are fewer than three noisy pixels in the level2.evt file, extra rows are filled as -1
| Pixel properties | Quadrant properties | ||||||
|---|---|---|---|---|---|---|---|
| Quadrant | DetID | PixID | Counts | Sigma | Mean | Median | Sigma |
| A | 8 | 5 | 48680060 | 20519.27 | 10678 | 10472 | 2371.9 |
| A | 8 | 15 | 1784151 | 747.79 | 10678 | 10472 | 2371.9 |
| A | 13 | 251 | 1762710 | 738.75 | 10678 | 10472 | 2371.9 |
| B | 4 | 239 | 27007298 | 12579.9 | 11003 | 10771 | 2146.0 |
| B | 0 | 214 | 1057473 | 487.74 | 11003 | 10771 | 2146.0 |
| B | 0 | 219 | 621668 | 284.67 | 11003 | 10771 | 2146.0 |
| C | 4 | 254 | 1222224 | 497.38 | 10970 | 10917 | 2435.4 |
| C | 14 | 234 | 146688 | 55.75 | 10970 | 10917 | 2435.4 |
| C | 15 | 48 | 125556 | 47.07 | 10970 | 10917 | 2435.4 |
| D | 1 | 52 | 14916815 | 5848.59 | 10808 | 10447 | 2548.7 |
| D | 8 | 195 | 7199598 | 2820.7 | 10808 | 10447 | 2548.7 |
| D | 5 | 222 | 2649573 | 1035.47 | 10808 | 10447 | 2548.7 |
Histogram calculated using DETX and DETY for each event in the final _common_clean file
| Quadrant A |  |
 |
Quadrant B |
|---|---|---|---|
| Quadrant D |  |
 |
Quadrant C |
| Plot type | Count rate plots | Images |
|---|---|---|
| Comparison with Poisson distribution Blue bars denote a histogram of data divided into 1 sec bins. Red curve is a Poisson curve with rate = median count rate of data. |
 |
 |
| Quadrant-wise count rates Data is divided into 100 sec bins |
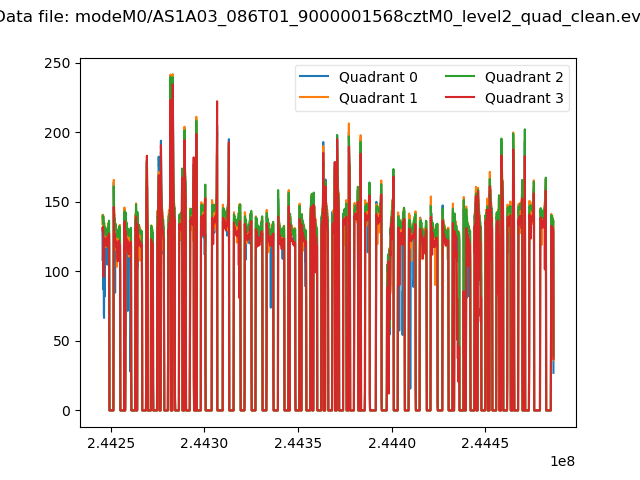 |
|
| Module-wise count rates for Quadrant A Data is divided into 100 sec bins |
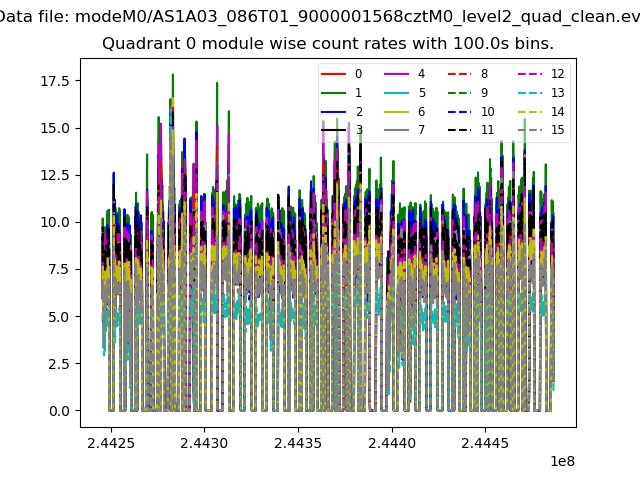 |
 |
| Module-wise count rates for Quadrant B Data is divided into 100 sec bins |
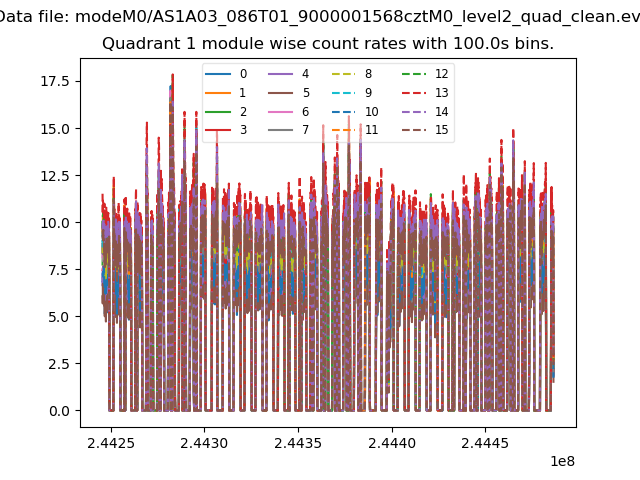 |
 |
| Module-wise count rates for Quadrant C Data is divided into 100 sec bins |
 |
 |
| Module-wise count rates for Quadrant D Data is divided into 100 sec bins |
 |
 |
| Parameter | Plot |
|---|---|
| CZT HV Monitor |  |
| D_VDD |  |
| Temperature 1 |  |
| Veto HV Monitor |  |
| Veto LLD |  |
| Alpha Counter |  |
| _CPM_Rate |  |
| CZT Counter |  |
| +2.5 Volts monitor |  |
| +5 Volts monitor |  |
| _ROLL_ROT |  |
| _Roll_DEC |  |
| _Roll_RA |  |
| Veto Counter |  |