| Param | Original file | Final file |
|---|---|---|
| Filename | modeM0/AS1A03_071T01_9000001562cztM0_level2_bc.evt | modeM0/AS1A03_071T01_9000001562cztM0_level2_quad_clean.evt |
| Size (bytes) | 2,468,450,880 | 689,348,160 |
| Size | 2.3 GB | 657.4 MB |
| Events in quadrant A | 18,056,188 | 4,230,777 |
| Events in quadrant B | 23,363,898 | 4,242,706 |
| Events in quadrant C | 10,935,401 | 4,534,779 |
| Events in quadrant D | 18,760,350 | 4,201,693 |
| Mode M9 | |||
|---|---|---|---|
| Quadrant | BADHDUFLAG | Total packets | Discarded packets |
| A | 0 | 88 | 0 |
| B | 0 | 88 | 0 |
| C | 0 | 88 | 0 |
| D | 0 | 88 | 0 |
| Mode M0 | |||
|---|---|---|---|
| Quadrant | BADHDUFLAG | Total packets | Discarded packets |
| A | 0 | 140890 | 0 |
| B | 0 | 165720 | 0 |
| C | 0 | 110820 | 0 |
| D | 0 | 138204 | 0 |
| Mode SS | |||
|---|---|---|---|
| Quadrant | BADHDUFLAG | Total packets | Discarded packets |
| A | 0 | 1088 | 0 |
| B | 0 | 1088 | 0 |
| C | 0 | 1088 | 0 |
| D | 0 | 1088 | 0 |
| Quadrant | Total seconds | Saturated seconds | Saturation percentage |
|---|---|---|---|
| A | 53449 | 3379 | 6.321914% |
| B | 53449 | 5883 | 11.006754% |
| C | 53449 | 490 | 0.916762% |
| D | 53450 | 1995 | 3.732460% |
Noise dominated data is calculated using 1-second bins in cleaned event files. If a bin has >2000 counts, and if more than 50% of those come from <1% of pixels, then it is considered to be noise-dominated and hence unusable.
| Quadrant | # 1 sec bins | Bins with >0 counts | Bins with >2000 counts | High rate bins dominated by noise | Noise dominated (total time) | Noise dominated (detector-on time) | Marked lightcurve |
|---|---|---|---|---|---|---|---|
| A | 61554 | 53449 | 387 | 387 | 0.63% | 0.72% |  |
| B | 61555 | 53448 | 284 | 284 | 0.46% | 0.53% |  |
| C | 61554 | 53452 | 8 | 8 | 0.01% | 0.01% | 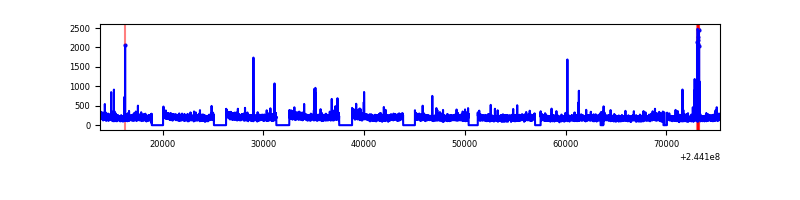 |
| D | 61554 | 53448 | 458 | 458 | 0.74% | 0.86% | 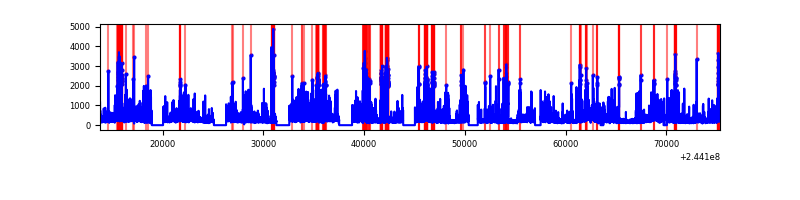 |
Top three noisy pixels from each quadrant. If the there are fewer than three noisy pixels in the level2.evt file, extra rows are filled as -1
| Pixel properties | Quadrant properties | ||||||
|---|---|---|---|---|---|---|---|
| Quadrant | DetID | PixID | Counts | Sigma | Mean | Median | Sigma |
| A | 8 | 5 | 7198533 | 12586.13 | 2666 | 2618 | 571.7 |
| A | 15 | 174 | 261443 | 452.7 | 2666 | 2618 | 571.7 |
| A | 8 | 15 | 143906 | 247.12 | 2666 | 2618 | 571.7 |
| B | 4 | 239 | 8136689 | 16298.72 | 2659 | 2592 | 499.1 |
| B | 0 | 85 | 2206127 | 4415.34 | 2659 | 2592 | 499.1 |
| B | 15 | 204 | 1169978 | 2339.15 | 2659 | 2592 | 499.1 |
| C | 14 | 234 | 164737 | 269.5 | 2746 | 2716 | 601.2 |
| C | 8 | 222 | 20040 | 28.82 | 2746 | 2716 | 601.2 |
| C | 13 | 61 | 16668 | 23.21 | 2746 | 2716 | 601.2 |
| D | 13 | 138 | 2241752 | 3649.71 | 2697 | 2607 | 613.5 |
| D | 8 | 195 | 1592007 | 2590.66 | 2697 | 2607 | 613.5 |
| D | 9 | 85 | 1137985 | 1850.62 | 2697 | 2607 | 613.5 |
Histogram calculated using DETX and DETY for each event in the final _common_clean file
| Quadrant A | 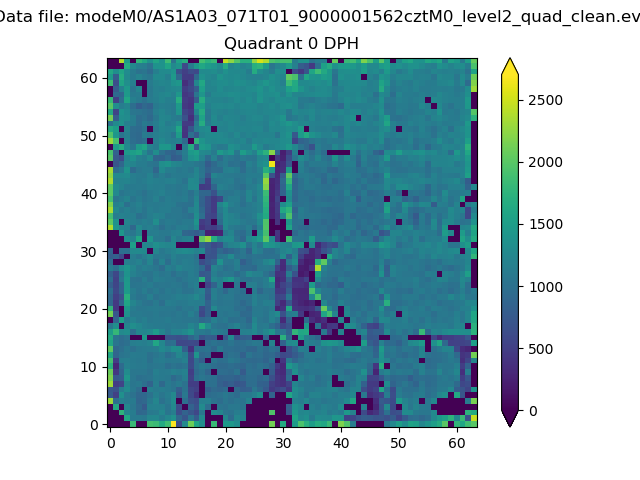 |
 |
Quadrant B |
|---|---|---|---|
| Quadrant D | 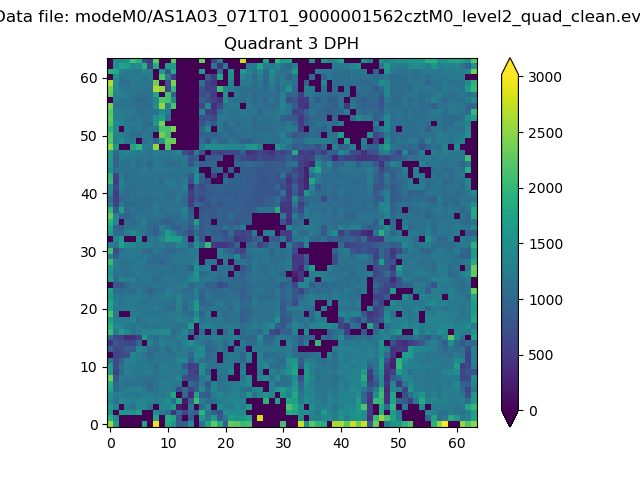 |
 |
Quadrant C |
| Plot type | Count rate plots | Images |
|---|---|---|
| Comparison with Poisson distribution Blue bars denote a histogram of data divided into 1 sec bins. Red curve is a Poisson curve with rate = median count rate of data. |
 |
 |
| Quadrant-wise count rates Data is divided into 100 sec bins |
 |
|
| Module-wise count rates for Quadrant A Data is divided into 100 sec bins |
 |
 |
| Module-wise count rates for Quadrant B Data is divided into 100 sec bins |
 |
 |
| Module-wise count rates for Quadrant C Data is divided into 100 sec bins |
 |
 |
| Module-wise count rates for Quadrant D Data is divided into 100 sec bins |
 |
 |
| Parameter | Plot |
|---|---|
| CZT HV Monitor | 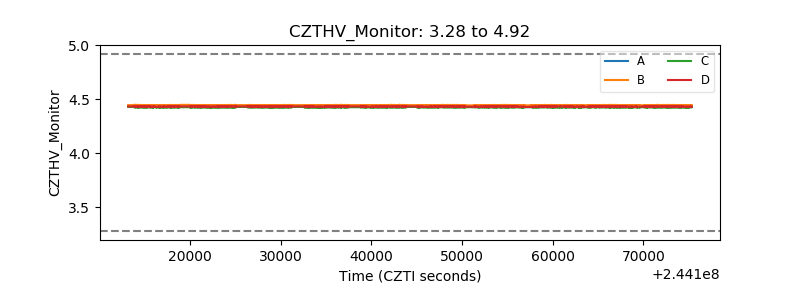 |
| D_VDD |  |
| Temperature 1 |  |
| Veto HV Monitor |  |
| Veto LLD | 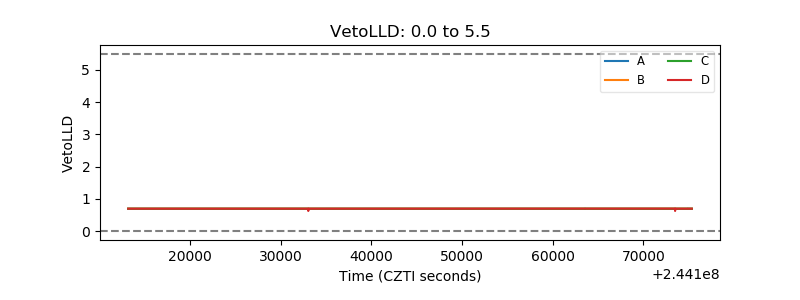 |
| Alpha Counter |  |
| _CPM_Rate |  |
| CZT Counter |  |
| +2.5 Volts monitor | 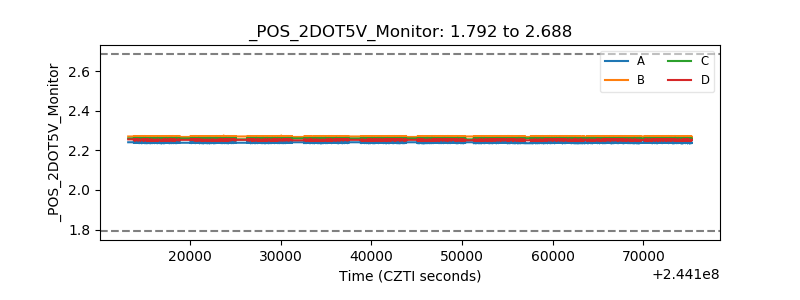 |
| +5 Volts monitor | 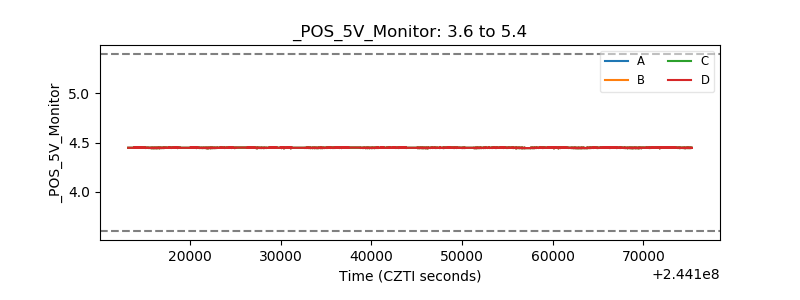 |
| _ROLL_ROT | 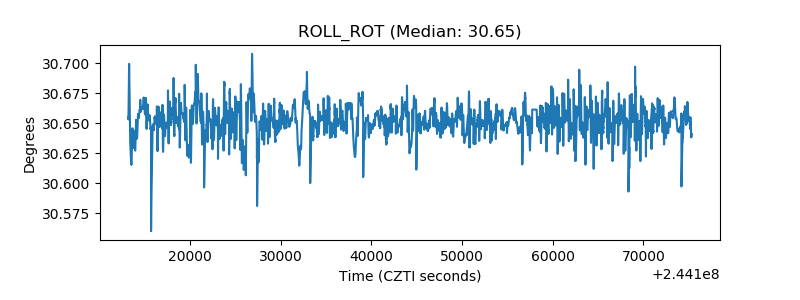 |
| _Roll_DEC |  |
| _Roll_RA | 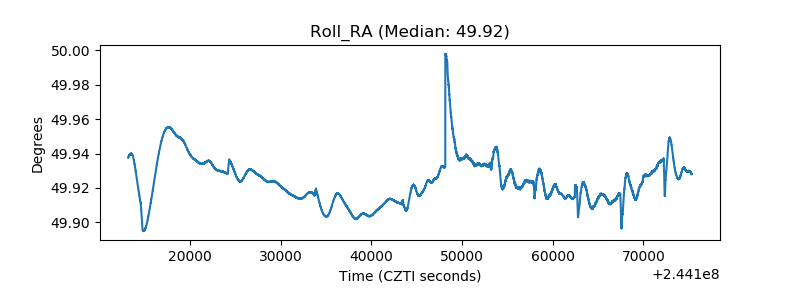 |
| Veto Counter |  |