| Param | Original file | Final file |
|---|---|---|
| Filename | modeM0/AS1G07_062T01_9000001560cztM0_level2.evt | modeM0/AS1G07_062T01_9000001560cztM0_level2_quad_clean.evt |
| Size (bytes) | 4,097,782,080 | 917,864,640 |
| Size | 3.8 GB | 875.3 MB |
| Events in quadrant A | 24,836,243 | 6,130,893 |
| Events in quadrant B | 37,507,166 | 6,017,255 |
| Events in quadrant C | 22,604,166 | 6,264,967 |
| Events in quadrant D | 35,661,151 | 5,832,944 |
| Mode M0 | |||
|---|---|---|---|
| Quadrant | BADHDUFLAG | Total packets | Discarded packets |
| A | 0 | 111009 | 0 |
| B | 0 | 147420 | 0 |
| C | 0 | 105677 | 0 |
| D | 0 | 140748 | 0 |
| Mode M9 | |||
|---|---|---|---|
| Quadrant | BADHDUFLAG | Total packets | Discarded packets |
| A | 0 | 61 | 0 |
| B | 0 | 61 | 0 |
| C | 0 | 61 | 0 |
| D | 0 | 61 | 0 |
| Mode SS | |||
|---|---|---|---|
| Quadrant | BADHDUFLAG | Total packets | Discarded packets |
| A | 0 | 1056 | 0 |
| B | 0 | 1058 | 0 |
| C | 0 | 1058 | 0 |
| D | 0 | 1058 | 0 |
| Quadrant | Total seconds | Saturated seconds | Saturation percentage |
|---|---|---|---|
| A | 51810 | 843 | 1.627099% |
| B | 51808 | 4803 | 9.270769% |
| C | 51801 | 305 | 0.588792% |
| D | 51811 | 2432 | 4.693984% |
Noise dominated data is calculated using 1-second bins in cleaned event files. If a bin has >2000 counts, and if more than 50% of those come from <1% of pixels, then it is considered to be noise-dominated and hence unusable.
| Quadrant | # 1 sec bins | Bins with >0 counts | Bins with >2000 counts | High rate bins dominated by noise | Noise dominated (total time) | Noise dominated (detector-on time) | Marked lightcurve |
|---|---|---|---|---|---|---|---|
| A | 58018 | 51829 | 402 | 402 | 0.69% | 0.78% |  |
| B | 58018 | 51828 | 2722 | 2722 | 4.69% | 5.25% |  |
| C | 58018 | 51829 | 41 | 41 | 0.07% | 0.08% |  |
| D | 58018 | 51829 | 1655 | 1655 | 2.85% | 3.19% |  |
Top three noisy pixels from each quadrant. If the there are fewer than three noisy pixels in the level2.evt file, extra rows are filled as -1
| Pixel properties | Quadrant properties | ||||||
|---|---|---|---|---|---|---|---|
| Quadrant | DetID | PixID | Counts | Sigma | Mean | Median | Sigma |
| A | 15 | 174 | 1233942 | 1051.65 | 5832 | 5710 | 1167.9 |
| A | 14 | 254 | 812770 | 691.03 | 5832 | 5710 | 1167.9 |
| A | 8 | 15 | 137943 | 113.22 | 5832 | 5710 | 1167.9 |
| B | 4 | 239 | 14152971 | 13340.12 | 5707 | 5561 | 1060.5 |
| B | 0 | 219 | 248298 | 228.89 | 5707 | 5561 | 1060.5 |
| B | 15 | 204 | 225410 | 207.3 | 5707 | 5561 | 1060.5 |
| C | 14 | 234 | 147677 | 108.26 | 5728 | 5740 | 1311.1 |
| C | 0 | 207 | 71201 | 49.93 | 5728 | 5740 | 1311.1 |
| C | 13 | 61 | 43378 | 28.71 | 5728 | 5740 | 1311.1 |
| D | 8 | 195 | 3303241 | 2463.79 | 5603 | 5441 | 1338.5 |
| D | 10 | 199 | 2447100 | 1824.16 | 5603 | 5441 | 1338.5 |
| D | 13 | 138 | 1529457 | 1138.59 | 5603 | 5441 | 1338.5 |
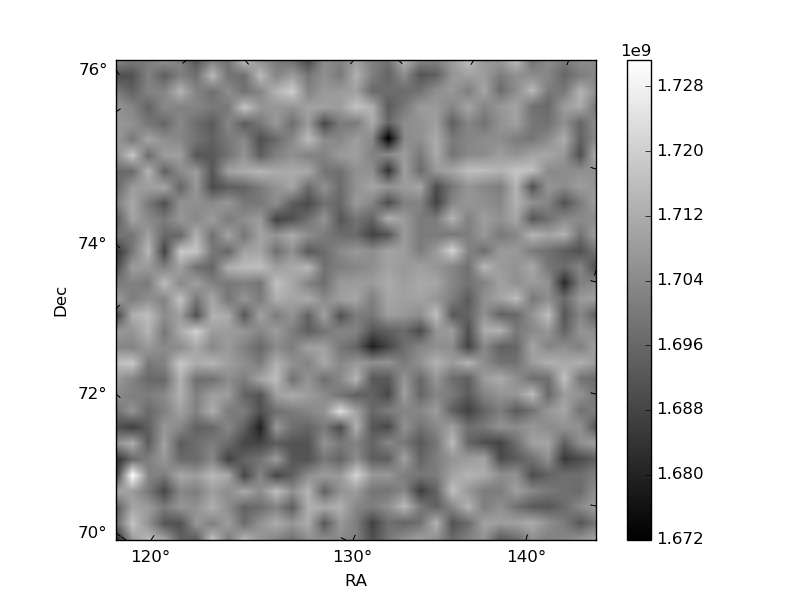
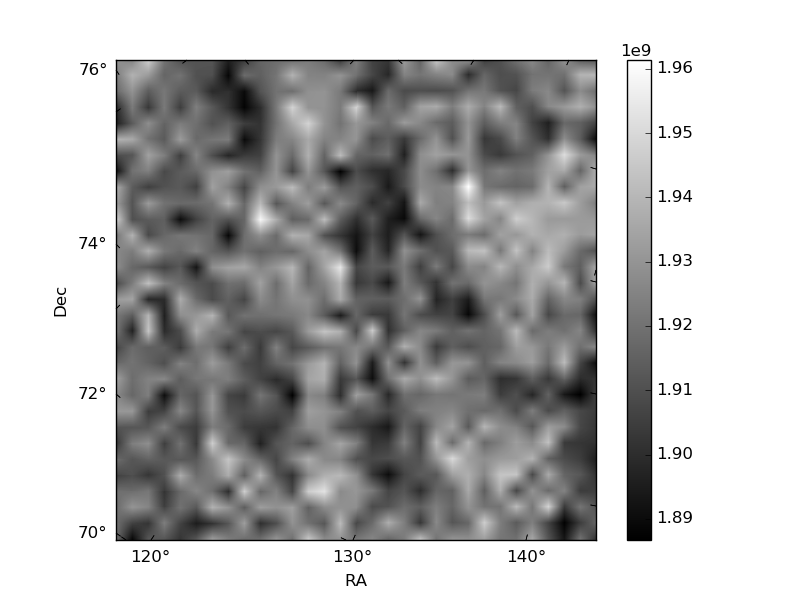
Histogram calculated using DETX and DETY for each event in the final _common_clean file
| Quadrant A |  |
 |
Quadrant B |
|---|---|---|---|
| Quadrant D |  |
 |
Quadrant C |
| Plot type | Count rate plots | Images |
|---|---|---|
| Comparison with Poisson distribution Blue bars denote a histogram of data divided into 1 sec bins. Red curve is a Poisson curve with rate = median count rate of data. |
 |
 |
| Quadrant-wise count rates Data is divided into 100 sec bins |
 |
|
| Module-wise count rates for Quadrant A Data is divided into 100 sec bins |
 |
 |
| Module-wise count rates for Quadrant B Data is divided into 100 sec bins |
 |
 |
| Module-wise count rates for Quadrant C Data is divided into 100 sec bins |
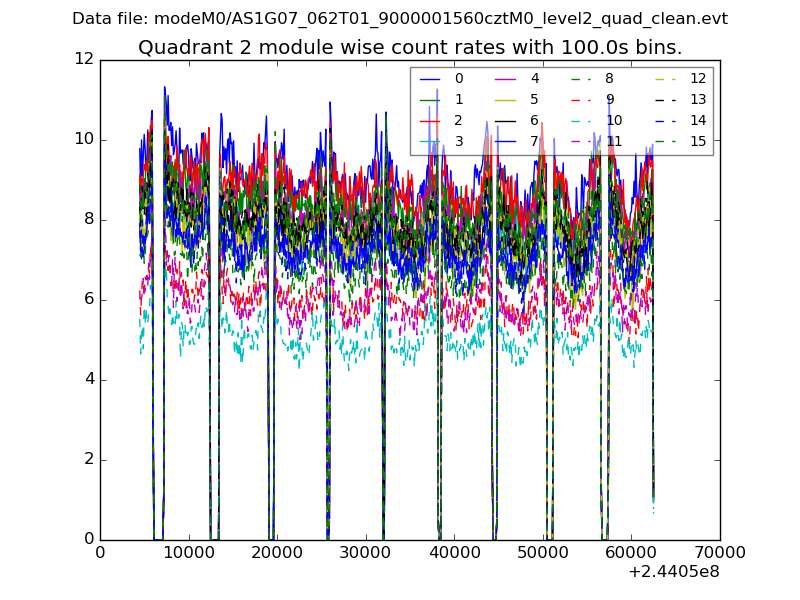 |
 |
| Module-wise count rates for Quadrant D Data is divided into 100 sec bins |
 |
 |
| Parameter | Plot |
|---|---|
| CZT HV Monitor |  |
| D_VDD |  |
| Temperature 1 |  |
| Veto HV Monitor |  |
| Veto LLD | 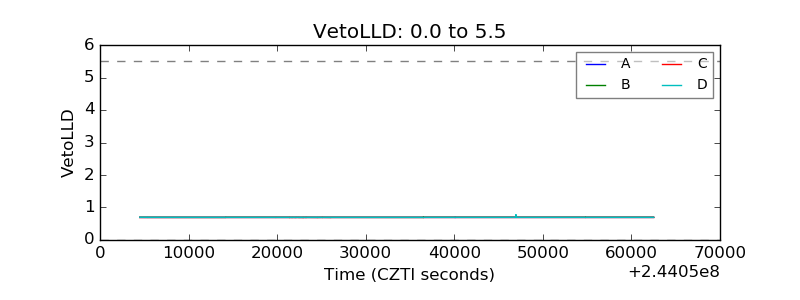 |
| Alpha Counter | 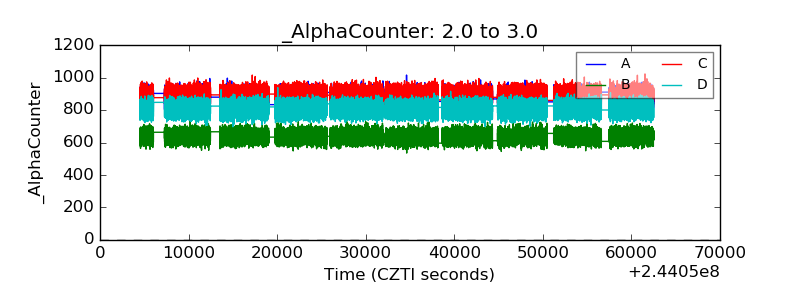 |
| _CPM_Rate |  |
| CZT Counter |  |
| +2.5 Volts monitor | 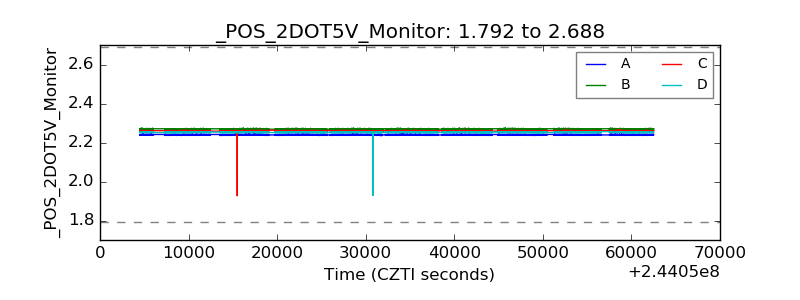 |
| +5 Volts monitor |  |
| _ROLL_ROT |  |
| _Roll_DEC |  |
| _Roll_RA |  |
| Veto Counter | 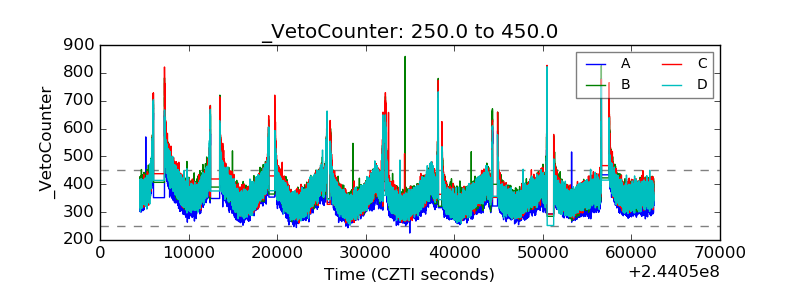 |