| Param | Original file | Final file |
|---|---|---|
| Filename | modeM0/AS1C02_045T03_9000001558cztM0_level2.evt | modeM0/AS1C02_045T03_9000001558cztM0_level2_quad_clean.evt |
| Size (bytes) | 640,679,040 | 154,200,960 |
| Size | 611.0 MB | 147.1 MB |
| Events in quadrant A | 3,956,298 | 1,056,827 |
| Events in quadrant B | 5,554,992 | 1,053,393 |
| Events in quadrant C | 3,577,767 | 1,061,883 |
| Events in quadrant D | 5,798,028 | 968,407 |
| Mode M0 | |||
|---|---|---|---|
| Quadrant | BADHDUFLAG | Total packets | Discarded packets |
| A | 0 | 16832 | 0 |
| B | 0 | 21598 | 0 |
| C | 0 | 15820 | 0 |
| D | 0 | 22447 | 0 |
| Mode SS | |||
|---|---|---|---|
| Quadrant | BADHDUFLAG | Total packets | Discarded packets |
| A | 0 | 156 | 0 |
| B | 0 | 156 | 0 |
| C | 0 | 156 | 0 |
| D | 0 | 156 | 0 |
| Mode M9 | |||
|---|---|---|---|
| Quadrant | BADHDUFLAG | Total packets | Discarded packets |
| A | 0 | 25 | 0 |
| B | 0 | 25 | 0 |
| C | 0 | 25 | 0 |
| D | 0 | 25 | 0 |
| Quadrant | Total seconds | Saturated seconds | Saturation percentage |
|---|---|---|---|
| A | 7613 | 223 | 2.929200% |
| B | 7609 | 650 | 8.542515% |
| C | 7618 | 118 | 1.548963% |
| D | 7613 | 676 | 8.879548% |
Noise dominated data is calculated using 1-second bins in cleaned event files. If a bin has >2000 counts, and if more than 50% of those come from <1% of pixels, then it is considered to be noise-dominated and hence unusable.
| Quadrant | # 1 sec bins | Bins with >0 counts | Bins with >2000 counts | High rate bins dominated by noise | Noise dominated (total time) | Noise dominated (detector-on time) | Marked lightcurve |
|---|---|---|---|---|---|---|---|
| A | 10187 | 7626 | 47 | 47 | 0.46% | 0.62% |  |
| B | 10187 | 7627 | 342 | 342 | 3.36% | 4.48% |  |
| C | 10187 | 7629 | 0 | 0 | 0.00% | 0.00% |  |
| D | 10187 | 7628 | 433 | 433 | 4.25% | 5.68% |  |
Top three noisy pixels from each quadrant. If the there are fewer than three noisy pixels in the level2.evt file, extra rows are filled as -1
| Pixel properties | Quadrant properties | ||||||
|---|---|---|---|---|---|---|---|
| Quadrant | DetID | PixID | Counts | Sigma | Mean | Median | Sigma |
| A | 15 | 174 | 248176 | 1320.69 | 945 | 927 | 187.2 |
| A | 1 | 162 | 32047 | 166.23 | 945 | 927 | 187.2 |
| A | 1 | 161 | 12017 | 59.24 | 945 | 927 | 187.2 |
| B | 4 | 239 | 1675741 | 9747.69 | 931 | 910 | 171.8 |
| B | 15 | 204 | 153498 | 888.08 | 931 | 910 | 171.8 |
| B | 0 | 219 | 48483 | 276.88 | 931 | 910 | 171.8 |
| C | 13 | 61 | 6904 | 28.99 | 914 | 919 | 206.5 |
| C | 8 | 222 | 5447 | 21.93 | 914 | 919 | 206.5 |
| C | 5 | 207 | 4140 | 15.6 | 914 | 919 | 206.5 |
| D | 13 | 104 | 713326 | 3473.56 | 879 | 856 | 205.1 |
| D | 10 | 199 | 552371 | 2688.85 | 879 | 856 | 205.1 |
| D | 5 | 222 | 298580 | 1451.52 | 879 | 856 | 205.1 |
Histogram calculated using DETX and DETY for each event in the final _common_clean file
| Quadrant A |  |
 |
Quadrant B |
|---|---|---|---|
| Quadrant D |  |
 |
Quadrant C |
| Plot type | Count rate plots | Images |
|---|---|---|
| Comparison with Poisson distribution Blue bars denote a histogram of data divided into 1 sec bins. Red curve is a Poisson curve with rate = median count rate of data. |
 |
 |
| Quadrant-wise count rates Data is divided into 100 sec bins |
 |
|
| Module-wise count rates for Quadrant A Data is divided into 100 sec bins |
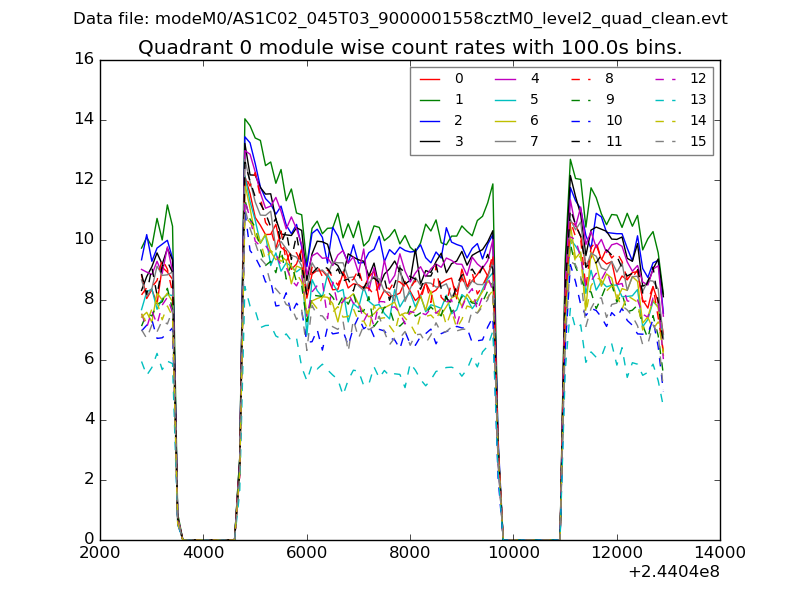 |
 |
| Module-wise count rates for Quadrant B Data is divided into 100 sec bins |
 |
 |
| Module-wise count rates for Quadrant C Data is divided into 100 sec bins |
 |
 |
| Module-wise count rates for Quadrant D Data is divided into 100 sec bins |
 |
 |
| Parameter | Plot |
|---|---|
| CZT HV Monitor | 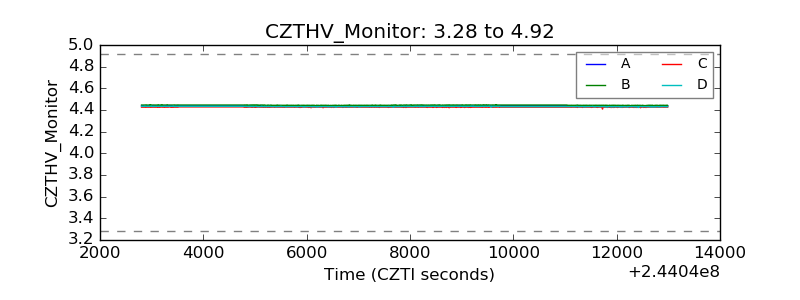 |
| D_VDD |  |
| Temperature 1 |  |
| Veto HV Monitor |  |
| Veto LLD |  |
| Alpha Counter |  |
| _CPM_Rate |  |
| CZT Counter |  |
| +2.5 Volts monitor |  |
| +5 Volts monitor | 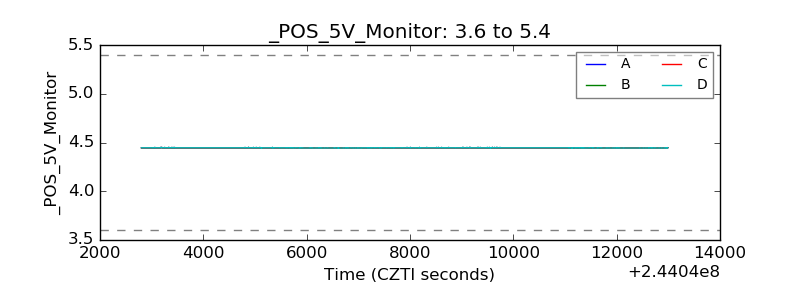 |
| _ROLL_ROT |  |
| _Roll_DEC | 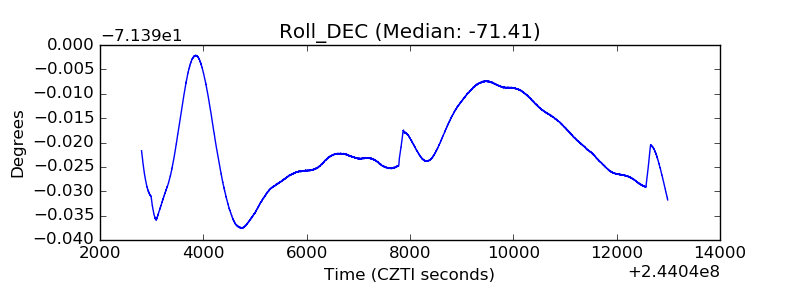 |
| _Roll_RA |  |
| Veto Counter |  |