| Param | Original file | Final file |
|---|---|---|
| Filename | modeM0/AS1G07_057T03_9000001552cztM0_level2.evt | modeM0/AS1G07_057T03_9000001552cztM0_level2_quad_clean.evt |
| Size (bytes) | 2,027,793,600 | 449,464,320 |
| Size | 1.9 GB | 428.6 MB |
| Events in quadrant A | 12,155,783 | 3,043,775 |
| Events in quadrant B | 19,528,823 | 2,971,953 |
| Events in quadrant C | 10,698,904 | 3,123,401 |
| Events in quadrant D | 17,475,555 | 2,888,368 |
| Mode M9 | |||
|---|---|---|---|
| Quadrant | BADHDUFLAG | Total packets | Discarded packets |
| A | 0 | 61 | 0 |
| B | 0 | 61 | 0 |
| C | 0 | 61 | 0 |
| D | 0 | 61 | 0 |
| Mode SS | |||
|---|---|---|---|
| Quadrant | BADHDUFLAG | Total packets | Discarded packets |
| A | 0 | 470 | 0 |
| B | 0 | 470 | 0 |
| C | 0 | 470 | 0 |
| D | 0 | 470 | 0 |
| Mode M0 | |||
|---|---|---|---|
| Quadrant | BADHDUFLAG | Total packets | Discarded packets |
| A | 0 | 51546 | 0 |
| B | 0 | 73273 | 0 |
| C | 0 | 47306 | 0 |
| D | 0 | 67812 | 0 |
| Quadrant | Total seconds | Saturated seconds | Saturation percentage |
|---|---|---|---|
| A | 23058 | 492 | 2.133750% |
| B | 23058 | 2594 | 11.249892% |
| C | 23058 | 194 | 0.841357% |
| D | 23058 | 1088 | 4.718536% |
Noise dominated data is calculated using 1-second bins in cleaned event files. If a bin has >2000 counts, and if more than 50% of those come from <1% of pixels, then it is considered to be noise-dominated and hence unusable.
| Quadrant | # 1 sec bins | Bins with >0 counts | Bins with >2000 counts | High rate bins dominated by noise | Noise dominated (total time) | Noise dominated (detector-on time) | Marked lightcurve |
|---|---|---|---|---|---|---|---|
| A | 29123 | 23062 | 137 | 137 | 0.47% | 0.59% |  |
| B | 29123 | 23061 | 1502 | 1502 | 5.16% | 6.51% |  |
| C | 29123 | 23063 | 1 | 1 | 0.00% | 0.00% |  |
| D | 29123 | 23063 | 788 | 788 | 2.71% | 3.42% |  |
Top three noisy pixels from each quadrant. If the there are fewer than three noisy pixels in the level2.evt file, extra rows are filled as -1
| Pixel properties | Quadrant properties | ||||||
|---|---|---|---|---|---|---|---|
| Quadrant | DetID | PixID | Counts | Sigma | Mean | Median | Sigma |
| A | 15 | 239 | 582577 | 1062.0 | 2758 | 2708 | 546.0 |
| A | 15 | 223 | 446326 | 812.46 | 2758 | 2708 | 546.0 |
| A | 15 | 174 | 137345 | 246.58 | 2758 | 2708 | 546.0 |
| B | 0 | 85 | 4295849 | 8703.76 | 2694 | 2631 | 493.3 |
| B | 4 | 239 | 4244691 | 8600.05 | 2694 | 2631 | 493.3 |
| B | 15 | 204 | 208156 | 416.67 | 2694 | 2631 | 493.3 |
| C | 13 | 61 | 20452 | 28.78 | 2735 | 2748 | 615.2 |
| C | 8 | 222 | 13002 | 16.67 | 2735 | 2748 | 615.2 |
| C | 14 | 234 | 10496 | 12.59 | 2735 | 2748 | 615.2 |
| D | 10 | 157 | 2084961 | 3314.34 | 2675 | 2604 | 628.3 |
| D | 10 | 199 | 1638308 | 2603.44 | 2675 | 2604 | 628.3 |
| D | 1 | 52 | 1248887 | 1983.62 | 2675 | 2604 | 628.3 |
Histogram calculated using DETX and DETY for each event in the final _common_clean file
| Quadrant A |  |
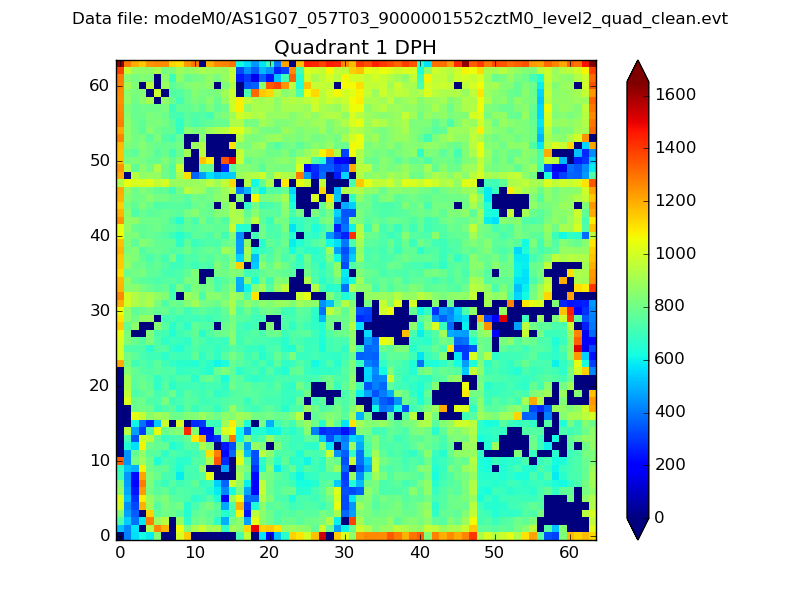 |
Quadrant B |
|---|---|---|---|
| Quadrant D |  |
 |
Quadrant C |
| Plot type | Count rate plots | Images |
|---|---|---|
| Comparison with Poisson distribution Blue bars denote a histogram of data divided into 1 sec bins. Red curve is a Poisson curve with rate = median count rate of data. |
 |
 |
| Quadrant-wise count rates Data is divided into 100 sec bins |
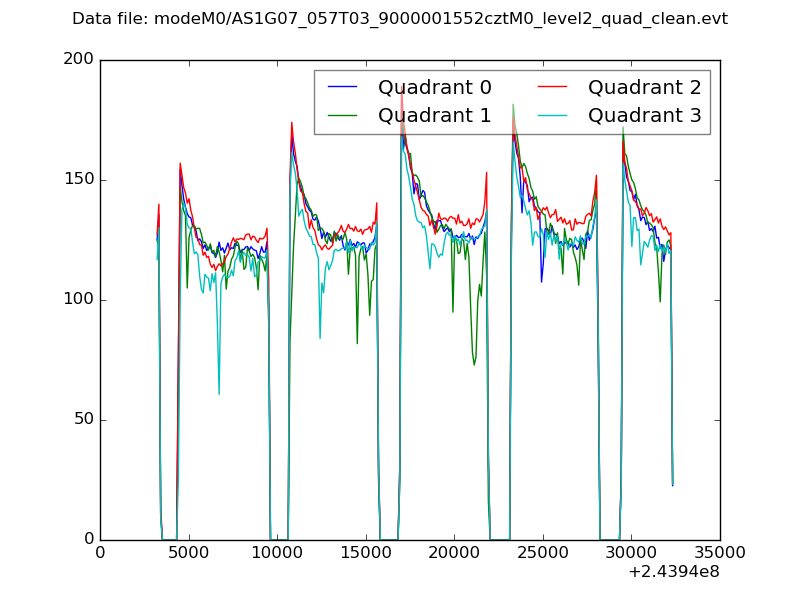 |
|
| Module-wise count rates for Quadrant A Data is divided into 100 sec bins |
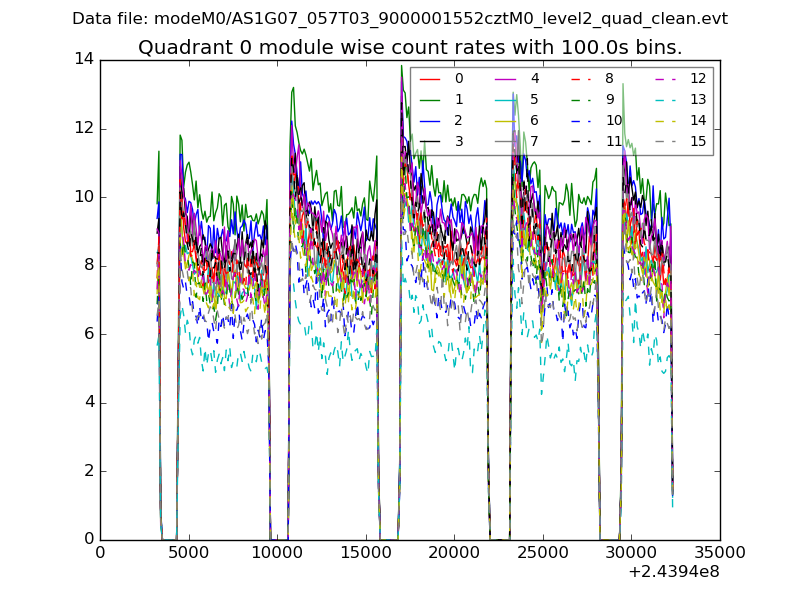 |
 |
| Module-wise count rates for Quadrant B Data is divided into 100 sec bins |
 |
 |
| Module-wise count rates for Quadrant C Data is divided into 100 sec bins |
 |
 |
| Module-wise count rates for Quadrant D Data is divided into 100 sec bins |
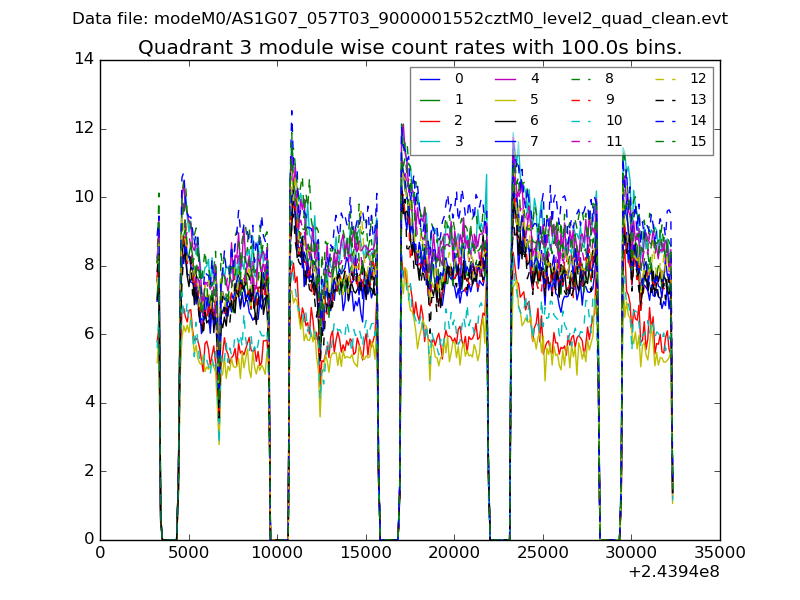 |
 |
| Parameter | Plot |
|---|---|
| CZT HV Monitor |  |
| D_VDD | 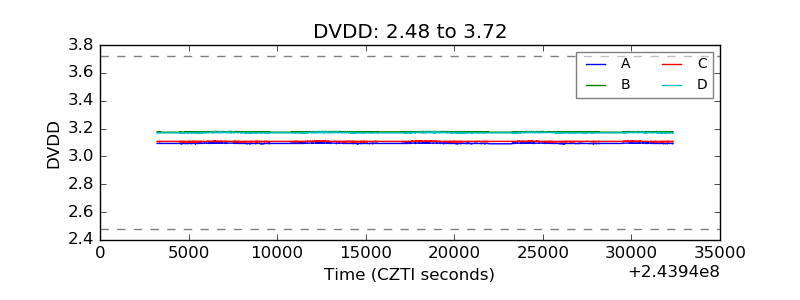 |
| Temperature 1 |  |
| Veto HV Monitor |  |
| Veto LLD |  |
| Alpha Counter |  |
| _CPM_Rate |  |
| CZT Counter |  |
| +2.5 Volts monitor |  |
| +5 Volts monitor | 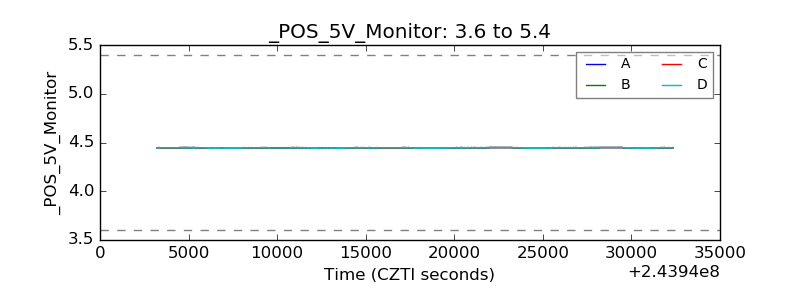 |
| _ROLL_ROT |  |
| _Roll_DEC | 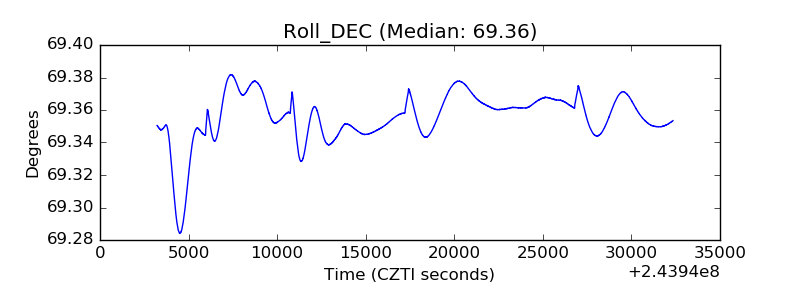 |
| _Roll_RA | 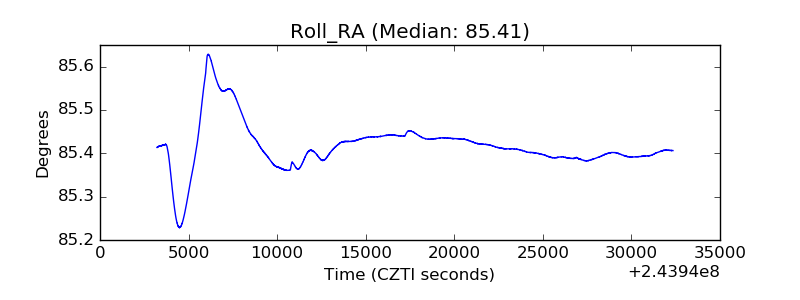 |
| Veto Counter |  |