| Param | Original file | Final file |
|---|---|---|
| Filename | modeM0/AS1G07_014T02_9000001556cztM0_level2.evt | modeM0/AS1G07_014T02_9000001556cztM0_level2_quad_clean.evt |
| Size (bytes) | 3,161,733,120 | 478,540,800 |
| Size | 2.9 GB | 456.4 MB |
| Events in quadrant A | 18,623,584 | 2,967,069 |
| Events in quadrant B | 27,215,505 | 2,925,371 |
| Events in quadrant C | 18,313,333 | 2,979,193 |
| Events in quadrant D | 28,845,297 | 2,815,381 |
| Mode SS | |||
|---|---|---|---|
| Quadrant | BADHDUFLAG | Total packets | Discarded packets |
| A | 0 | 834 | 0 |
| B | 0 | 834 | 0 |
| C | 0 | 834 | 0 |
| D | 0 | 834 | 0 |
| Mode M0 | |||
|---|---|---|---|
| Quadrant | BADHDUFLAG | Total packets | Discarded packets |
| A | 0 | 83736 | 0 |
| B | 0 | 107617 | 0 |
| C | 0 | 83369 | 0 |
| D | 0 | 113128 | 0 |
| Mode M9 | |||
|---|---|---|---|
| Quadrant | BADHDUFLAG | Total packets | Discarded packets |
| A | 0 | 52 | 0 |
| B | 0 | 52 | 0 |
| C | 0 | 52 | 0 |
| D | 0 | 52 | 0 |
| Quadrant | Total seconds | Saturated seconds | Saturation percentage |
|---|---|---|---|
| A | 40863 | 374 | 0.915253% |
| B | 40863 | 2664 | 6.519345% |
| C | 40863 | 314 | 0.768421% |
| D | 40863 | 1696 | 4.150454% |
Noise dominated data is calculated using 1-second bins in cleaned event files. If a bin has >2000 counts, and if more than 50% of those come from <1% of pixels, then it is considered to be noise-dominated and hence unusable.
| Quadrant | # 1 sec bins | Bins with >0 counts | Bins with >2000 counts | High rate bins dominated by noise | Noise dominated (total time) | Noise dominated (detector-on time) | Marked lightcurve |
|---|---|---|---|---|---|---|---|
| A | 46263 | 40867 | 7 | 7 | 0.02% | 0.02% |  |
| B | 46263 | 40867 | 1475 | 1475 | 3.19% | 3.61% | 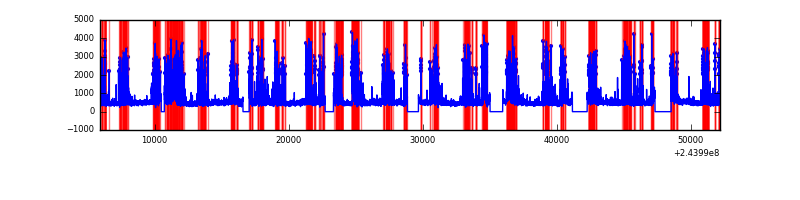 |
| C | 46263 | 40868 | 0 | 0 | 0.00% | 0.00% |  |
| D | 46263 | 40867 | 1172 | 1172 | 2.53% | 2.87% |  |
Top three noisy pixels from each quadrant. If the there are fewer than three noisy pixels in the level2.evt file, extra rows are filled as -1
| Pixel properties | Quadrant properties | ||||||
|---|---|---|---|---|---|---|---|
| Quadrant | DetID | PixID | Counts | Sigma | Mean | Median | Sigma |
| A | 1 | 162 | 66636 | 64.1 | 4788 | 4682 | 966.5 |
| A | 0 | 226 | 43791 | 40.47 | 4788 | 4682 | 966.5 |
| A | 15 | 174 | 42374 | 39.0 | 4788 | 4682 | 966.5 |
| B | 4 | 239 | 7932618 | 8930.96 | 4713 | 4599 | 887.7 |
| B | 0 | 214 | 285175 | 316.07 | 4713 | 4599 | 887.7 |
| B | 0 | 85 | 244459 | 270.2 | 4713 | 4599 | 887.7 |
| C | 13 | 61 | 34855 | 27.99 | 4690 | 4709 | 1076.9 |
| C | 14 | 234 | 23251 | 17.22 | 4690 | 4709 | 1076.9 |
| C | 8 | 222 | 18497 | 12.8 | 4690 | 4709 | 1076.9 |
| D | 13 | 104 | 3407441 | 3086.09 | 4596 | 4475 | 1102.7 |
| D | 1 | 52 | 2522419 | 2283.48 | 4596 | 4475 | 1102.7 |
| D | 8 | 195 | 2065444 | 1869.06 | 4596 | 4475 | 1102.7 |
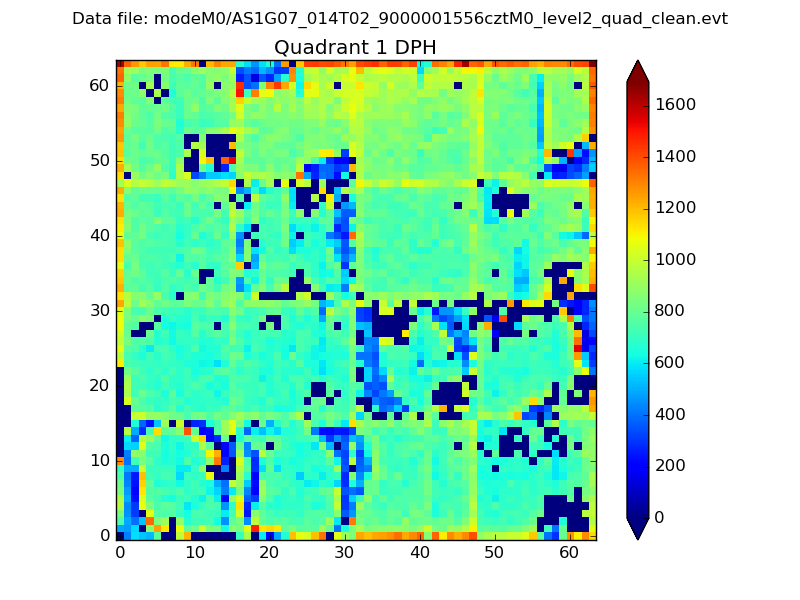
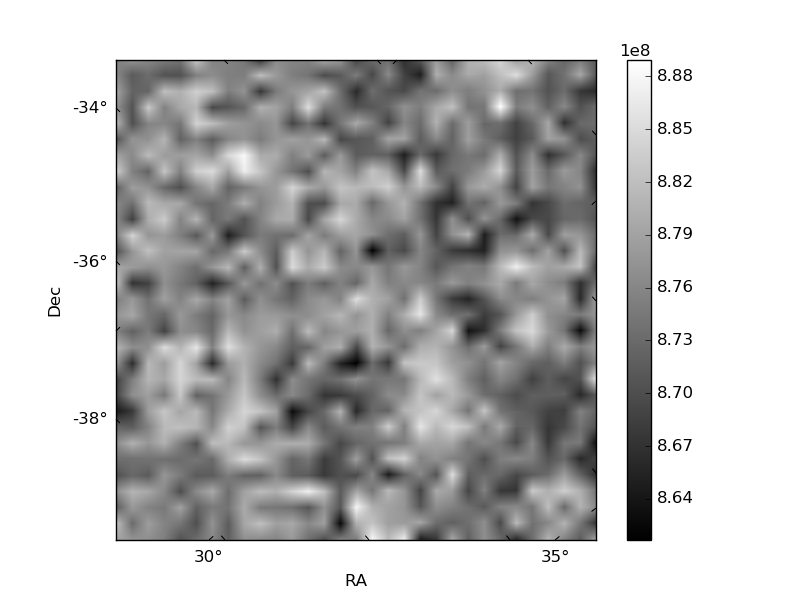
Histogram calculated using DETX and DETY for each event in the final _common_clean file
| Quadrant A |  |
 |
Quadrant B |
|---|---|---|---|
| Quadrant D | 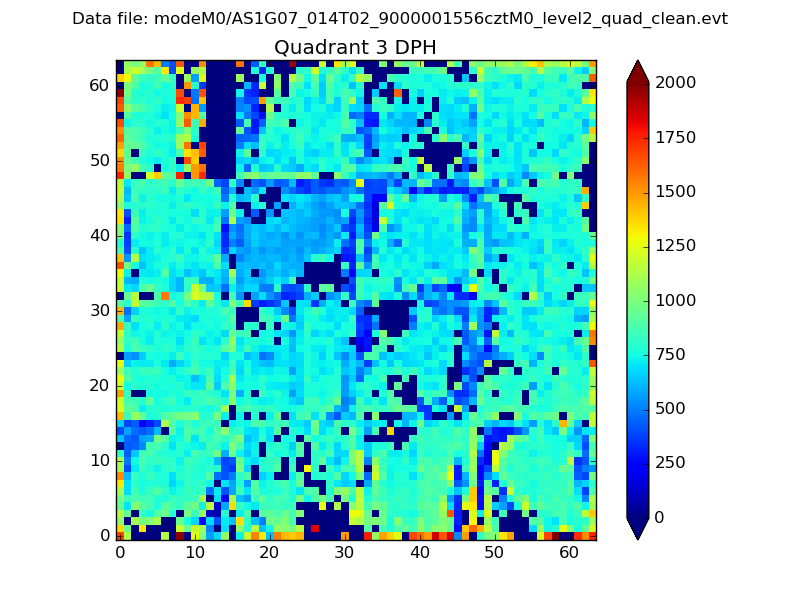 |
 |
Quadrant C |
| Plot type | Count rate plots | Images |
|---|---|---|
| Comparison with Poisson distribution Blue bars denote a histogram of data divided into 1 sec bins. Red curve is a Poisson curve with rate = median count rate of data. |
 |
 |
| Quadrant-wise count rates Data is divided into 100 sec bins |
 |
|
| Module-wise count rates for Quadrant A Data is divided into 100 sec bins |
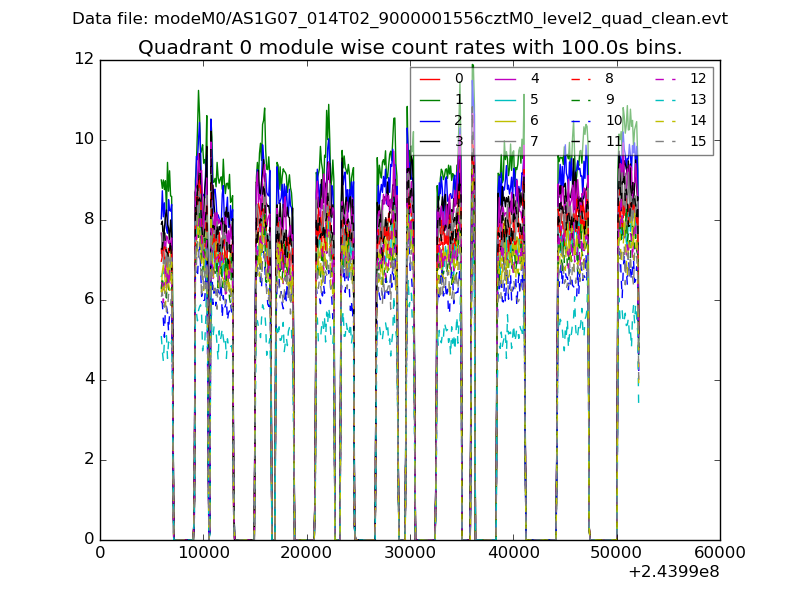 |
 |
| Module-wise count rates for Quadrant B Data is divided into 100 sec bins |
 |
 |
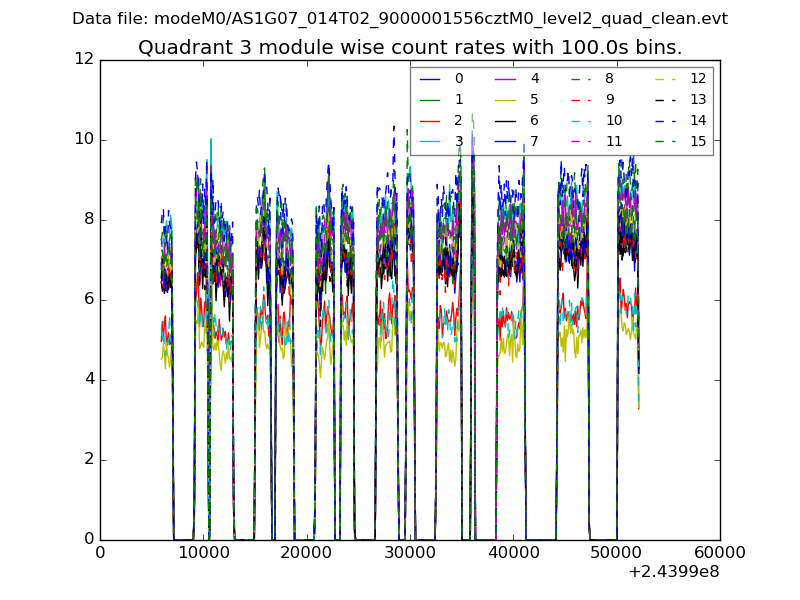
| Module-wise count rates for Quadrant C Data is divided into 100 sec bins |
 |
 |
| Module-wise count rates for Quadrant D Data is divided into 100 sec bins |
 |
 |
| Parameter | Plot |
|---|---|
| CZT HV Monitor |  |
| D_VDD |  |
| Temperature 1 |  |
| Veto HV Monitor |  |
| Veto LLD | 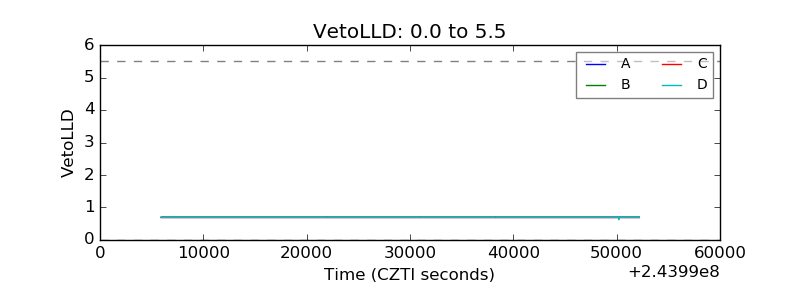 |
| Alpha Counter |  |
| _CPM_Rate |  |
| CZT Counter | 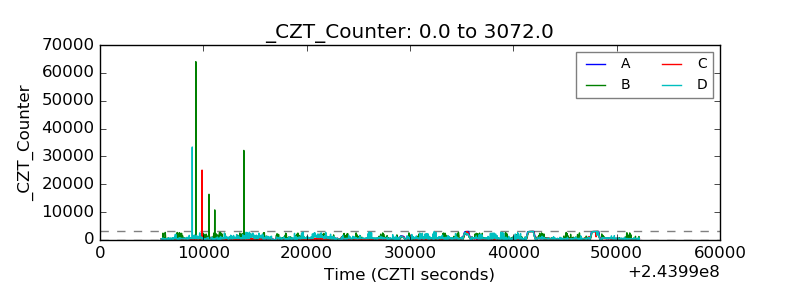 |
| +2.5 Volts monitor |  |
| +5 Volts monitor |  |
| _ROLL_ROT |  |
| _Roll_DEC |  |
| _Roll_RA |  |
| Veto Counter |  |