| Param | Original file | Final file |
|---|---|---|
| Filename | modeM0/AS1G07_051T01_9000001550cztM0_level2.evt | modeM0/AS1G07_051T01_9000001550cztM0_level2_quad_clean.evt |
| Size (bytes) | 4,072,049,280 | 583,056,000 |
| Size | 3.8 GB | 556.0 MB |
| Events in quadrant A | 24,323,470 | 3,626,223 |
| Events in quadrant B | 36,500,140 | 3,580,810 |
| Events in quadrant C | 22,547,986 | 3,658,688 |
| Events in quadrant D | 36,584,258 | 3,362,494 |
| Mode SS | |||
|---|---|---|---|
| Quadrant | BADHDUFLAG | Total packets | Discarded packets |
| A | 0 | 1020 | 0 |
| B | 0 | 1020 | 0 |
| C | 0 | 1020 | 0 |
| D | 0 | 1020 | 0 |
| Mode M9 | |||
|---|---|---|---|
| Quadrant | BADHDUFLAG | Total packets | Discarded packets |
| A | 0 | 60 | 0 |
| B | 0 | 60 | 0 |
| C | 0 | 60 | 0 |
| D | 0 | 60 | 0 |
| Mode M0 | |||
|---|---|---|---|
| Quadrant | BADHDUFLAG | Total packets | Discarded packets |
| A | 0 | 105702 | 0 |
| B | 0 | 141848 | 0 |
| C | 0 | 102372 | 0 |
| D | 0 | 142228 | 0 |
| Quadrant | Total seconds | Saturated seconds | Saturation percentage |
|---|---|---|---|
| A | 49980 | 618 | 1.236495% |
| B | 49979 | 3601 | 7.205026% |
| C | 49978 | 315 | 0.630277% |
| D | 49979 | 3214 | 6.430701% |
Noise dominated data is calculated using 1-second bins in cleaned event files. If a bin has >2000 counts, and if more than 50% of those come from <1% of pixels, then it is considered to be noise-dominated and hence unusable.
| Quadrant | # 1 sec bins | Bins with >0 counts | Bins with >2000 counts | High rate bins dominated by noise | Noise dominated (total time) | Noise dominated (detector-on time) | Marked lightcurve |
|---|---|---|---|---|---|---|---|
| A | 56011 | 49991 | 99 | 99 | 0.18% | 0.20% |  |
| B | 56011 | 49991 | 1805 | 1805 | 3.22% | 3.61% | 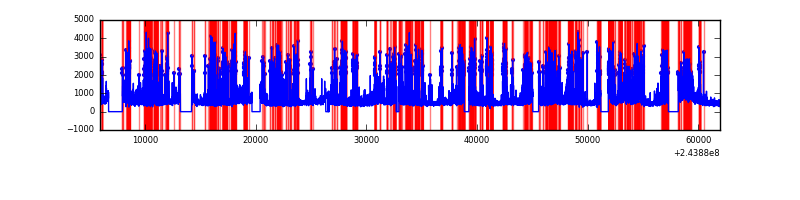 |
| C | 56011 | 49993 | 1 | 1 | 0.00% | 0.00% |  |
| D | 56011 | 49993 | 2470 | 2470 | 4.41% | 4.94% |  |
Top three noisy pixels from each quadrant. If the there are fewer than three noisy pixels in the level2.evt file, extra rows are filled as -1
| Pixel properties | Quadrant properties | ||||||
|---|---|---|---|---|---|---|---|
| Quadrant | DetID | PixID | Counts | Sigma | Mean | Median | Sigma |
| A | 15 | 239 | 687228 | 567.21 | 5928 | 5797 | 1201.4 |
| A | 15 | 174 | 252662 | 205.49 | 5928 | 5797 | 1201.4 |
| A | 15 | 223 | 207375 | 167.79 | 5928 | 5797 | 1201.4 |
| B | 4 | 239 | 7152885 | 6416.79 | 5843 | 5700 | 1113.8 |
| B | 0 | 85 | 5422104 | 4862.89 | 5843 | 5700 | 1113.8 |
| B | 4 | 81 | 388352 | 343.55 | 5843 | 5700 | 1113.8 |
| C | 13 | 61 | 43298 | 28.0 | 5772 | 5791 | 1339.7 |
| C | 14 | 234 | 18256 | 9.3 | 5772 | 5791 | 1339.7 |
| C | 8 | 222 | 16981 | 8.35 | 5772 | 5791 | 1339.7 |
| D | 10 | 157 | 6093510 | 4509.77 | 5608 | 5451 | 1350.0 |
| D | 1 | 52 | 4205724 | 3111.38 | 5608 | 5451 | 1350.0 |
| D | 8 | 195 | 1790836 | 1322.54 | 5608 | 5451 | 1350.0 |
Histogram calculated using DETX and DETY for each event in the final _common_clean file
| Quadrant A | 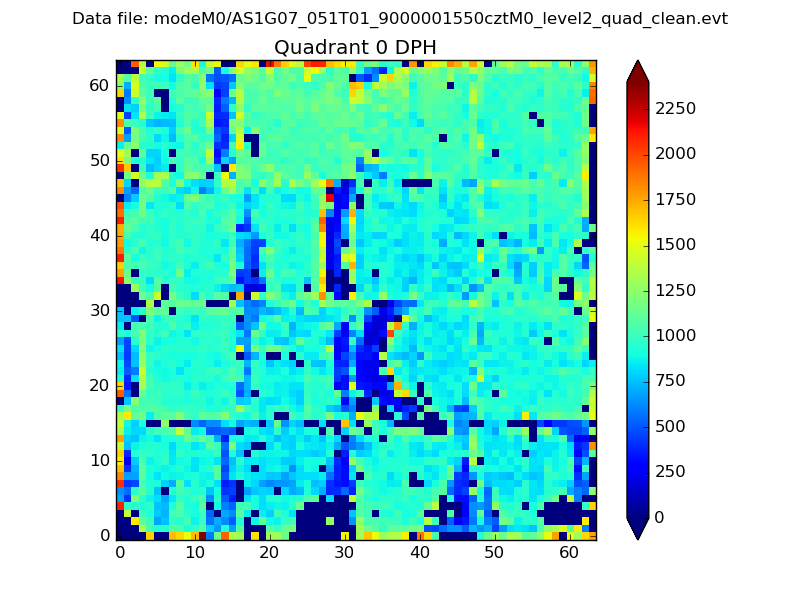 |
 |
Quadrant B |
|---|---|---|---|
| Quadrant D |  |
 |
Quadrant C |
| Plot type | Count rate plots | Images |
|---|---|---|
| Comparison with Poisson distribution Blue bars denote a histogram of data divided into 1 sec bins. Red curve is a Poisson curve with rate = median count rate of data. |
 |
 |
| Quadrant-wise count rates Data is divided into 100 sec bins |
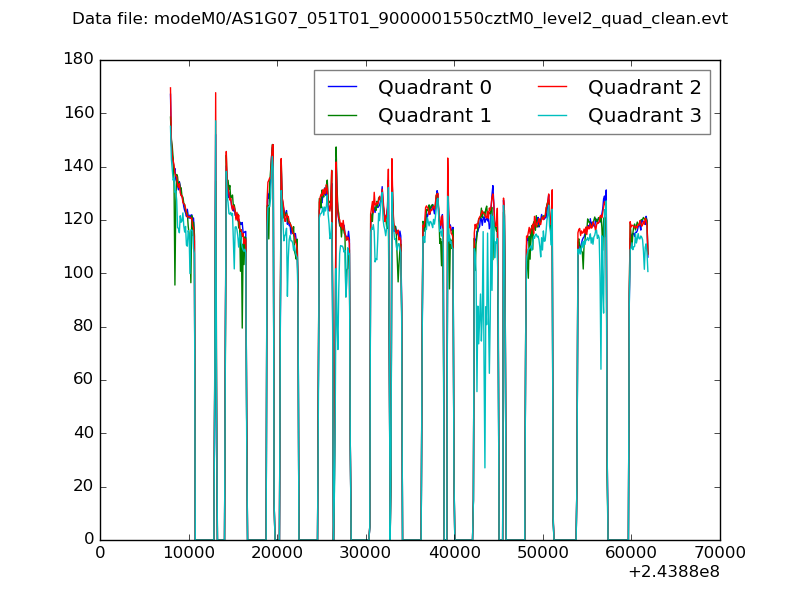 |
|
| Module-wise count rates for Quadrant A Data is divided into 100 sec bins |
 |
 |
| Module-wise count rates for Quadrant B Data is divided into 100 sec bins |
 |
 |
| Module-wise count rates for Quadrant C Data is divided into 100 sec bins |
 |
 |
| Module-wise count rates for Quadrant D Data is divided into 100 sec bins |
 |
 |
| Parameter | Plot |
|---|---|
| CZT HV Monitor |  |
| D_VDD | 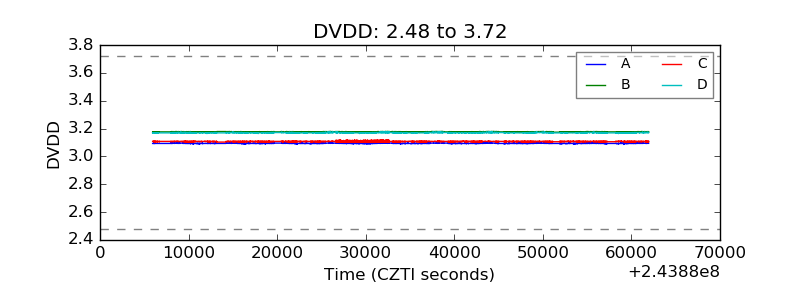 |
| Temperature 1 | 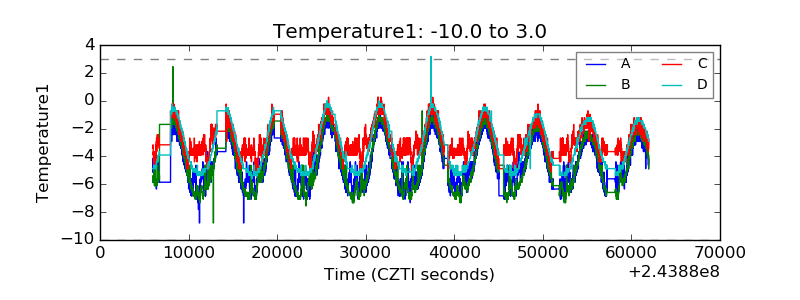 |
| Veto HV Monitor |  |
| Veto LLD | 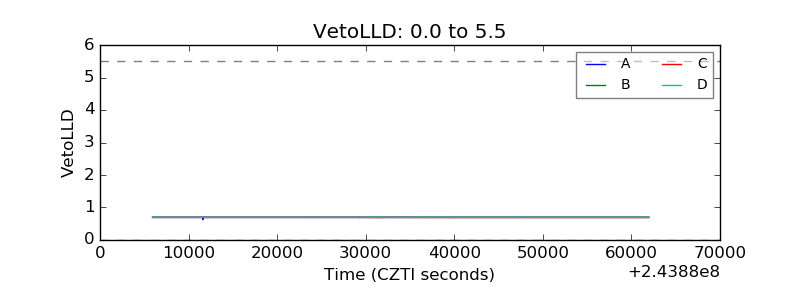 |
| Alpha Counter |  |
| _CPM_Rate |  |
| CZT Counter |  |
| +2.5 Volts monitor |  |
| +5 Volts monitor |  |
| _ROLL_ROT |  |
| _Roll_DEC |  |
| _Roll_RA |  |
| Veto Counter |  |