| Param | Original file | Final file |
|---|---|---|
| Filename | modeM0/AS1A03_064T01_9000001548cztM0_level2.evt | modeM0/AS1A03_064T01_9000001548cztM0_level2_quad_clean.evt |
| Size (bytes) | 2,279,658,240 | 329,284,800 |
| Size | 2.1 GB | 314.0 MB |
| Events in quadrant A | 12,904,383 | 2,110,310 |
| Events in quadrant B | 17,167,313 | 2,110,507 |
| Events in quadrant C | 11,886,193 | 2,133,785 |
| Events in quadrant D | 25,430,695 | 1,930,161 |
| Mode SS | |||
|---|---|---|---|
| Quadrant | BADHDUFLAG | Total packets | Discarded packets |
| A | 0 | 502 | 0 |
| B | 0 | 502 | 0 |
| C | 0 | 502 | 0 |
| D | 0 | 502 | 0 |
| Mode M9 | |||
|---|---|---|---|
| Quadrant | BADHDUFLAG | Total packets | Discarded packets |
| A | 0 | 57 | 0 |
| B | 0 | 57 | 0 |
| C | 0 | 57 | 0 |
| D | 0 | 57 | 0 |
| Mode M0 | |||
|---|---|---|---|
| Quadrant | BADHDUFLAG | Total packets | Discarded packets |
| A | 0 | 54325 | 0 |
| B | 0 | 67275 | 0 |
| C | 0 | 51328 | 0 |
| D | 0 | 92442 | 0 |
| Quadrant | Total seconds | Saturated seconds | Saturation percentage |
|---|---|---|---|
| A | 24524 | 501 | 2.042897% |
| B | 24525 | 1198 | 4.884811% |
| C | 24525 | 274 | 1.117227% |
| D | 24525 | 3792 | 15.461774% |
Noise dominated data is calculated using 1-second bins in cleaned event files. If a bin has >2000 counts, and if more than 50% of those come from <1% of pixels, then it is considered to be noise-dominated and hence unusable.
| Quadrant | # 1 sec bins | Bins with >0 counts | Bins with >2000 counts | High rate bins dominated by noise | Noise dominated (total time) | Noise dominated (detector-on time) | Marked lightcurve |
|---|---|---|---|---|---|---|---|
| A | 30350 | 24526 | 135 | 135 | 0.44% | 0.55% |  |
| B | 30350 | 24526 | 475 | 475 | 1.57% | 1.94% | 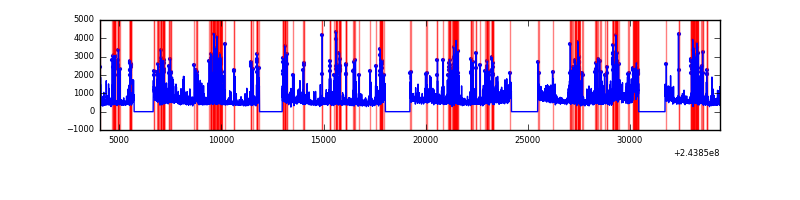 |
| C | 30350 | 24528 | 0 | 0 | 0.00% | 0.00% |  |
| D | 30350 | 24527 | 3133 | 3133 | 10.32% | 12.77% | 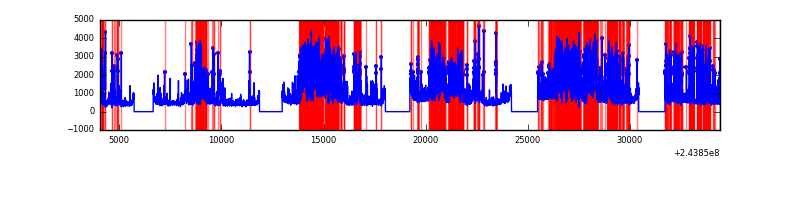 |
Top three noisy pixels from each quadrant. If the there are fewer than three noisy pixels in the level2.evt file, extra rows are filled as -1
| Pixel properties | Quadrant properties | ||||||
|---|---|---|---|---|---|---|---|
| Quadrant | DetID | PixID | Counts | Sigma | Mean | Median | Sigma |
| A | 15 | 239 | 420044 | 675.3 | 3081 | 3023 | 617.5 |
| A | 15 | 223 | 183826 | 292.78 | 3081 | 3023 | 617.5 |
| A | 15 | 174 | 155174 | 246.38 | 3081 | 3023 | 617.5 |
| B | 4 | 239 | 2791519 | 4863.6 | 3067 | 3001 | 573.3 |
| B | 0 | 85 | 1498225 | 2607.9 | 3067 | 3001 | 573.3 |
| B | 4 | 81 | 412258 | 713.81 | 3067 | 3001 | 573.3 |
| C | 13 | 61 | 22592 | 27.92 | 3042 | 3069 | 699.1 |
| C | 8 | 128 | 13381 | 14.75 | 3042 | 3069 | 699.1 |
| C | 14 | 234 | 11070 | 11.44 | 3042 | 3069 | 699.1 |
| D | 2 | 16 | 11620302 | 16956.89 | 2863 | 2786 | 685.1 |
| D | 10 | 157 | 1188448 | 1730.59 | 2863 | 2786 | 685.1 |
| D | 1 | 52 | 541834 | 786.79 | 2863 | 2786 | 685.1 |
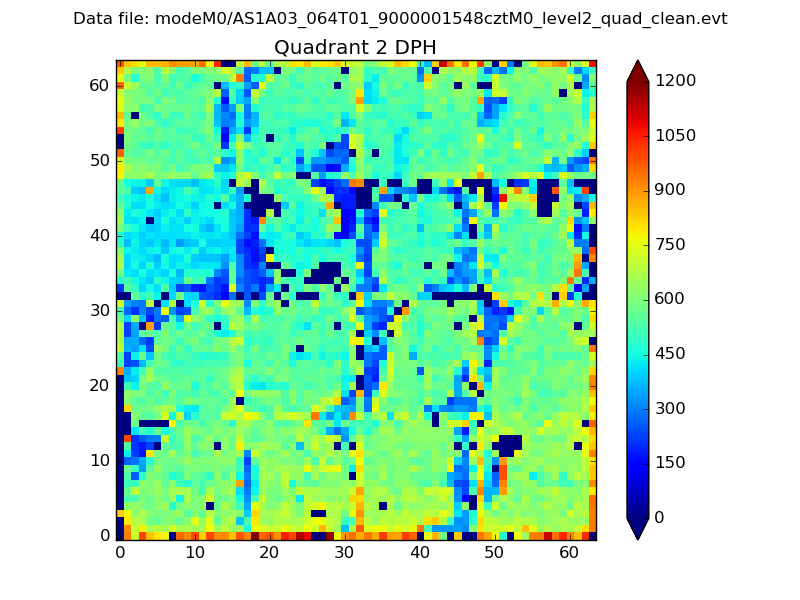
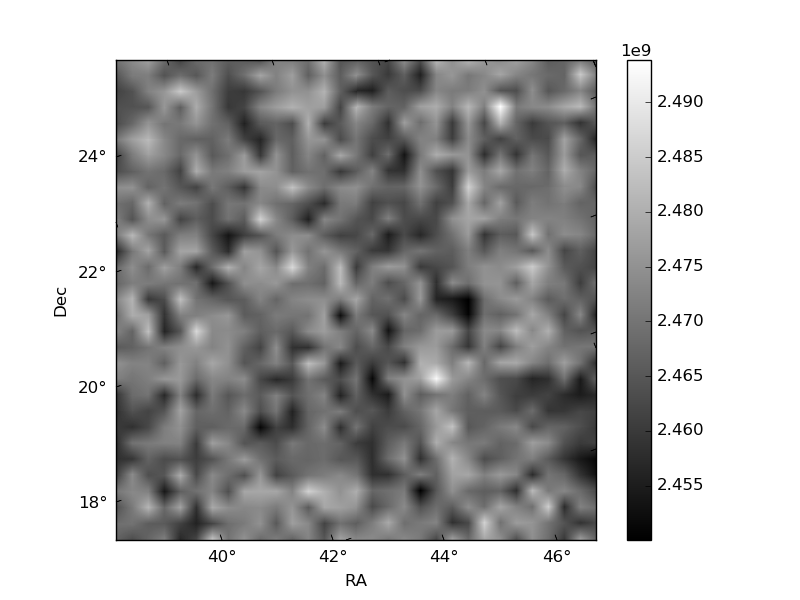
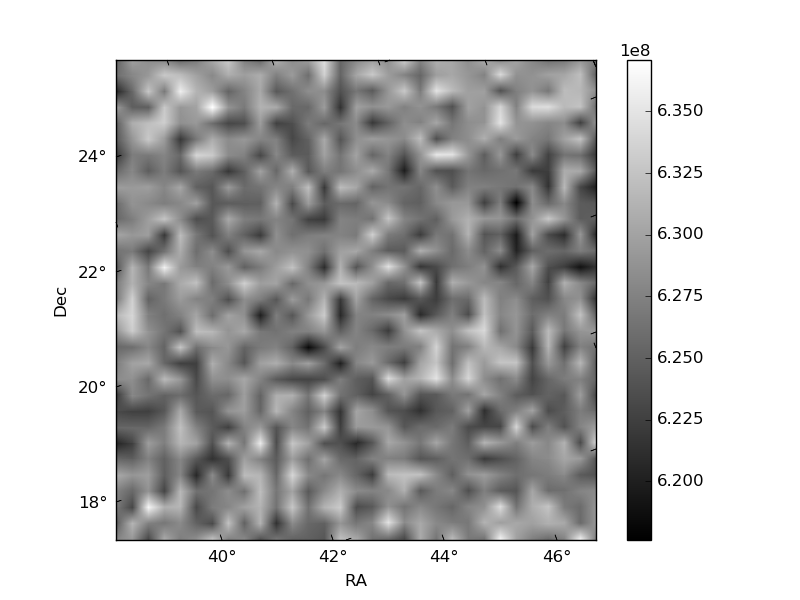
Histogram calculated using DETX and DETY for each event in the final _common_clean file
| Quadrant A |  |
 |
Quadrant B |
|---|---|---|---|
| Quadrant D |  |
 |
Quadrant C |
| Plot type | Count rate plots | Images |
|---|---|---|
| Comparison with Poisson distribution Blue bars denote a histogram of data divided into 1 sec bins. Red curve is a Poisson curve with rate = median count rate of data. |
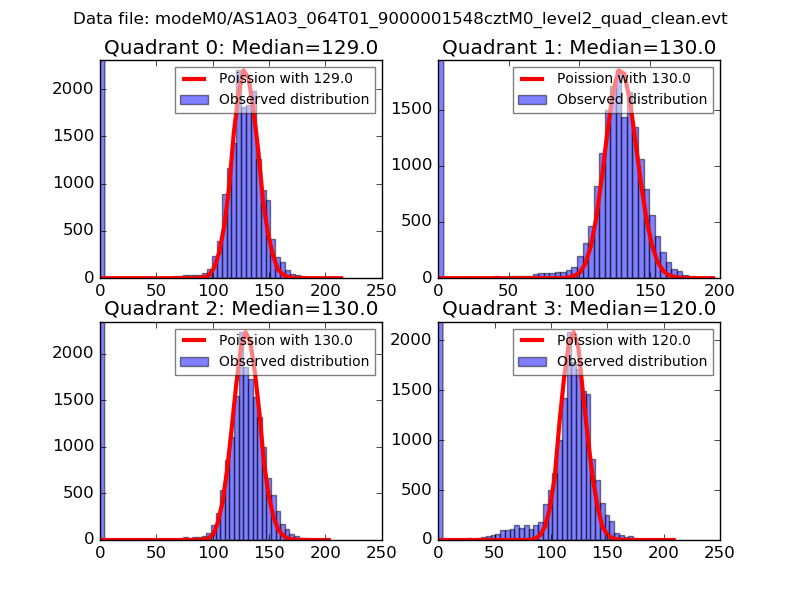 |
 |
| Quadrant-wise count rates Data is divided into 100 sec bins |
 |
|
| Module-wise count rates for Quadrant A Data is divided into 100 sec bins |
 |
 |
| Module-wise count rates for Quadrant B Data is divided into 100 sec bins |
 |
 |
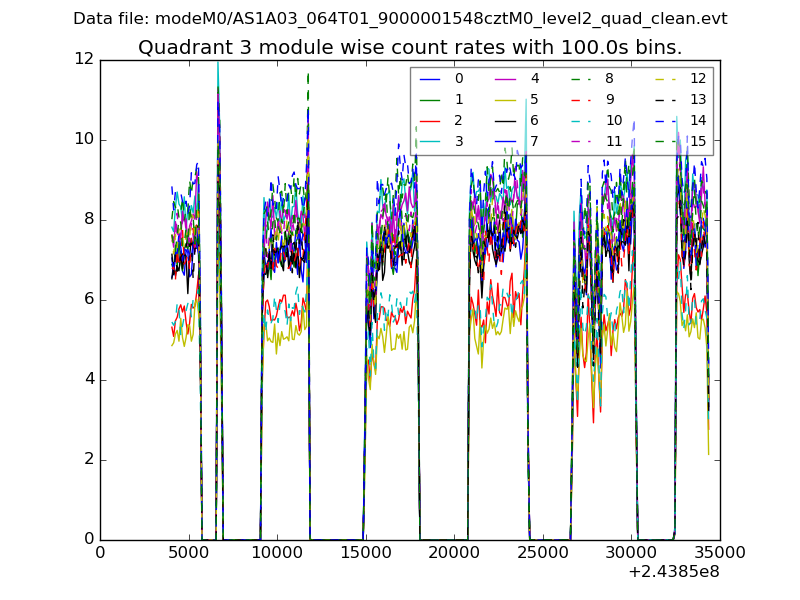
| Module-wise count rates for Quadrant C Data is divided into 100 sec bins |
 |
 |
| Module-wise count rates for Quadrant D Data is divided into 100 sec bins |
 |
 |
| Parameter | Plot |
|---|---|
| CZT HV Monitor |  |
| D_VDD |  |
| Temperature 1 |  |
| Veto HV Monitor |  |
| Veto LLD |  |
| Alpha Counter |  |
| _CPM_Rate |  |
| CZT Counter |  |
| +2.5 Volts monitor |  |
| +5 Volts monitor |  |
| _ROLL_ROT | 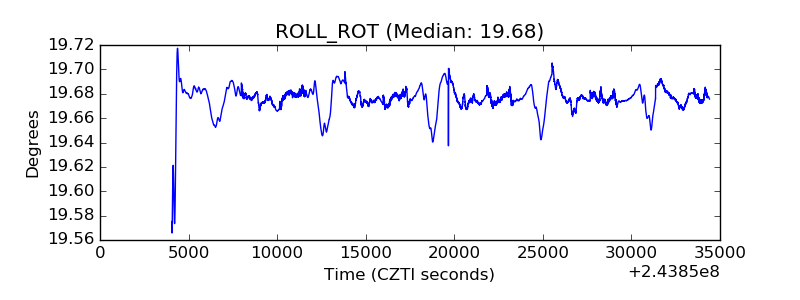 |
| _Roll_DEC | 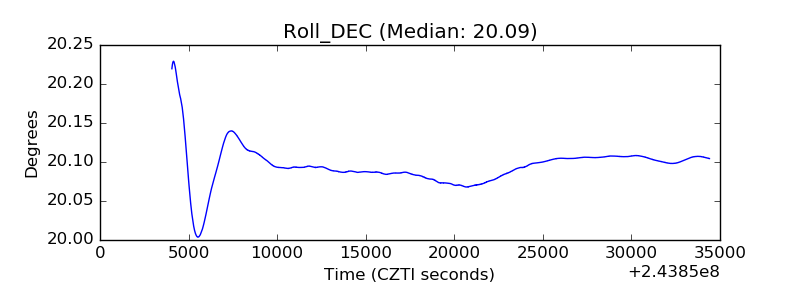 |
| _Roll_RA |  |
| Veto Counter |  |