| Param | Original file | Final file |
|---|---|---|
| Filename | modeM0/AS1A03_084T01_9000001544cztM0_level2.evt | modeM0/AS1A03_084T01_9000001544cztM0_level2_quad_clean.evt |
| Size (bytes) | 1,828,111,680 | 282,925,440 |
| Size | 1.7 GB | 269.8 MB |
| Events in quadrant A | 10,870,668 | 1,815,851 |
| Events in quadrant B | 16,738,223 | 1,776,132 |
| Events in quadrant C | 10,256,169 | 1,777,127 |
| Events in quadrant D | 15,972,750 | 1,641,531 |
| Mode SS | |||
|---|---|---|---|
| Quadrant | BADHDUFLAG | Total packets | Discarded packets |
| A | 0 | 462 | 0 |
| B | 0 | 462 | 0 |
| C | 0 | 462 | 0 |
| D | 0 | 462 | 0 |
| Mode M9 | |||
|---|---|---|---|
| Quadrant | BADHDUFLAG | Total packets | Discarded packets |
| A | 0 | 53 | 0 |
| B | 0 | 53 | 0 |
| C | 0 | 53 | 0 |
| D | 0 | 53 | 0 |
| Mode M0 | |||
|---|---|---|---|
| Quadrant | BADHDUFLAG | Total packets | Discarded packets |
| A | 0 | 47630 | 0 |
| B | 0 | 64676 | 0 |
| C | 0 | 46502 | 0 |
| D | 0 | 62146 | 0 |
| Quadrant | Total seconds | Saturated seconds | Saturation percentage |
|---|---|---|---|
| A | 22641 | 265 | 1.170443% |
| B | 22642 | 1497 | 6.611607% |
| C | 22642 | 144 | 0.635986% |
| D | 22642 | 893 | 3.943998% |
Noise dominated data is calculated using 1-second bins in cleaned event files. If a bin has >2000 counts, and if more than 50% of those come from <1% of pixels, then it is considered to be noise-dominated and hence unusable.
| Quadrant | # 1 sec bins | Bins with >0 counts | Bins with >2000 counts | High rate bins dominated by noise | Noise dominated (total time) | Noise dominated (detector-on time) | Marked lightcurve |
|---|---|---|---|---|---|---|---|
| A | 27962 | 22647 | 14 | 14 | 0.05% | 0.06% |  |
| B | 27963 | 22646 | 940 | 940 | 3.36% | 4.15% |  |
| C | 27963 | 22648 | 1 | 1 | 0.00% | 0.00% |  |
| D | 27963 | 22648 | 670 | 670 | 2.40% | 2.96% | 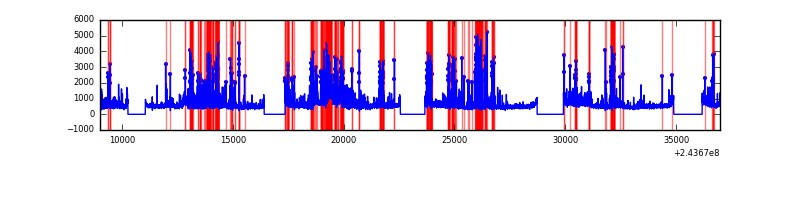 |
Top three noisy pixels from each quadrant. If the there are fewer than three noisy pixels in the level2.evt file, extra rows are filled as -1
| Pixel properties | Quadrant properties | ||||||
|---|---|---|---|---|---|---|---|
| Quadrant | DetID | PixID | Counts | Sigma | Mean | Median | Sigma |
| A | 13 | 251 | 105107 | 186.19 | 2728 | 2668 | 550.2 |
| A | 15 | 174 | 86089 | 151.63 | 2728 | 2668 | 550.2 |
| A | 1 | 162 | 68278 | 119.25 | 2728 | 2668 | 550.2 |
| B | 4 | 239 | 3947315 | 7719.68 | 2690 | 2631 | 511.0 |
| B | 4 | 81 | 1506028 | 2942.12 | 2690 | 2631 | 511.0 |
| B | 0 | 85 | 194119 | 374.74 | 2690 | 2631 | 511.0 |
| C | 14 | 234 | 24912 | 37.04 | 2618 | 2630 | 601.6 |
| C | 13 | 61 | 19789 | 28.52 | 2618 | 2630 | 601.6 |
| C | 15 | 48 | 9142 | 10.82 | 2618 | 2630 | 601.6 |
| D | 10 | 199 | 1901082 | 3058.2 | 2580 | 2505 | 620.8 |
| D | 2 | 16 | 1284709 | 2065.36 | 2580 | 2505 | 620.8 |
| D | 8 | 195 | 976969 | 1569.65 | 2580 | 2505 | 620.8 |
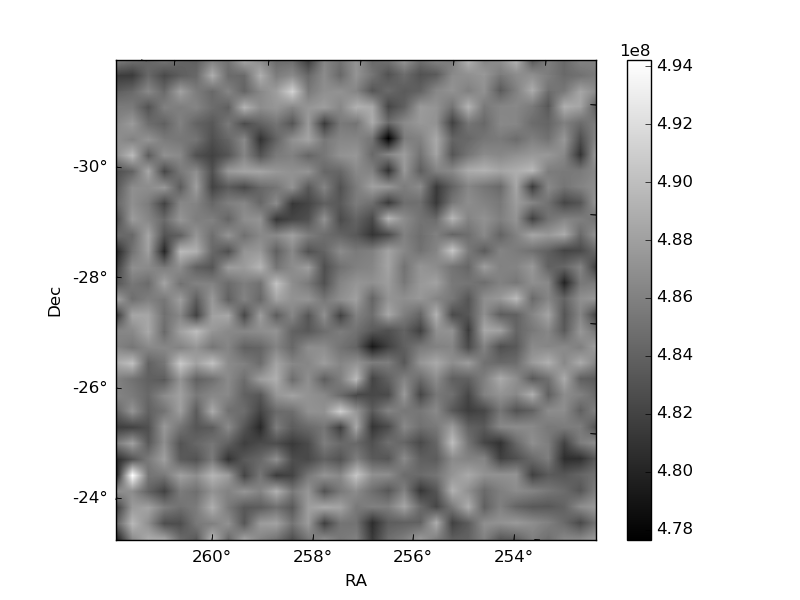
Histogram calculated using DETX and DETY for each event in the final _common_clean file
| Quadrant A | 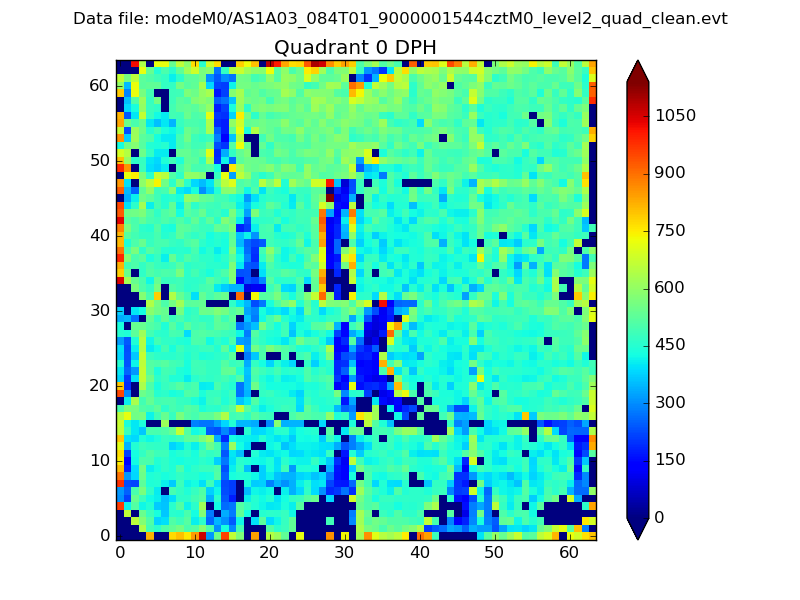 |
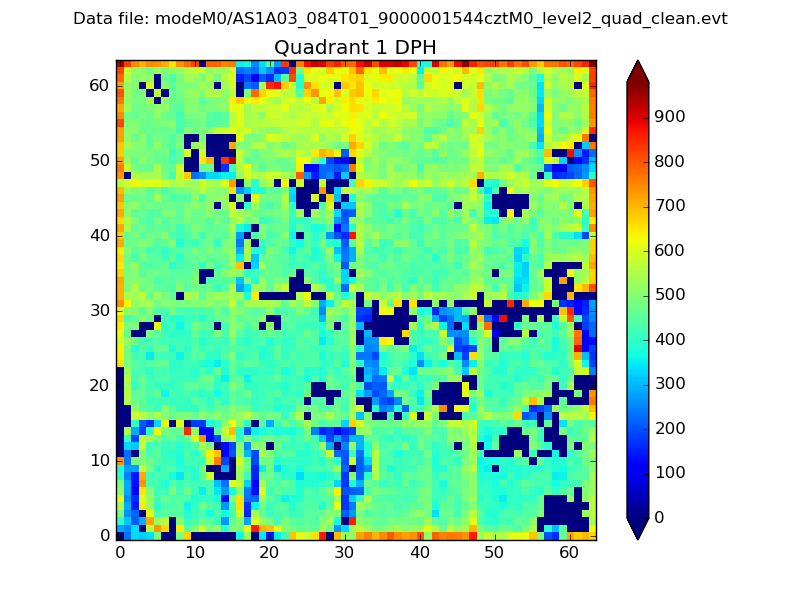 |
Quadrant B |
|---|---|---|---|
| Quadrant D |  |
 |
Quadrant C |
| Plot type | Count rate plots | Images |
|---|---|---|
| Comparison with Poisson distribution Blue bars denote a histogram of data divided into 1 sec bins. Red curve is a Poisson curve with rate = median count rate of data. |
 |
 |
| Quadrant-wise count rates Data is divided into 100 sec bins |
 |
|
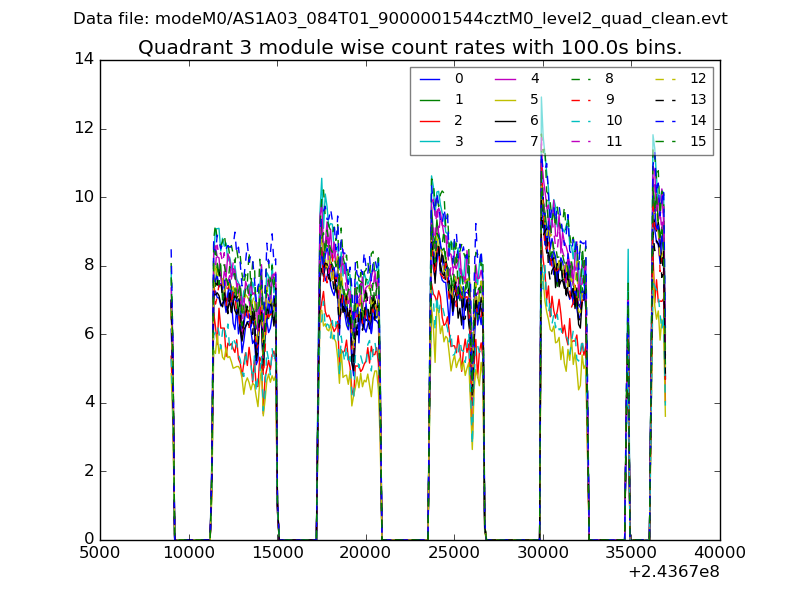
| Module-wise count rates for Quadrant A Data is divided into 100 sec bins |
 |
 |
| Module-wise count rates for Quadrant B Data is divided into 100 sec bins |
 |
 |
| Module-wise count rates for Quadrant C Data is divided into 100 sec bins |
 |
 |
| Module-wise count rates for Quadrant D Data is divided into 100 sec bins |
 |
 |
| Parameter | Plot |
|---|---|
| CZT HV Monitor | 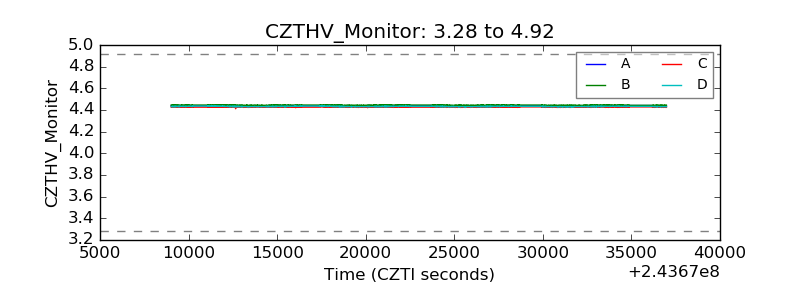 |
| D_VDD |  |
| Temperature 1 |  |
| Veto HV Monitor |  |
| Veto LLD | 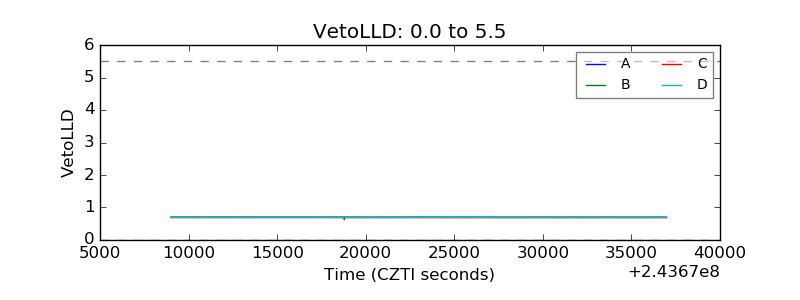 |
| Alpha Counter |  |
| _CPM_Rate |  |
| CZT Counter |  |
| +2.5 Volts monitor |  |
| +5 Volts monitor |  |
| _ROLL_ROT |  |
| _Roll_DEC | 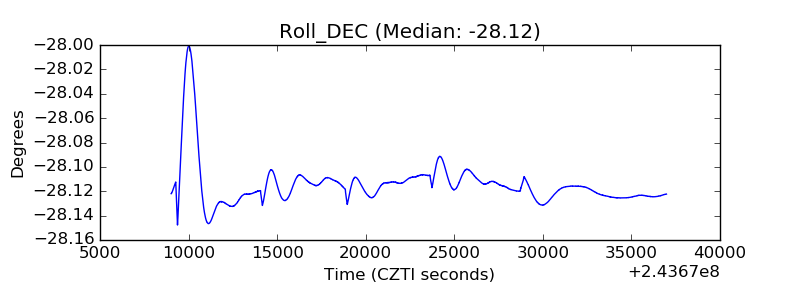 |
| _Roll_RA |  |
| Veto Counter |  |