| Param | Original file | Final file |
|---|---|---|
| Filename | modeM0/AS1A03_078T01_9000001546cztM0_level2.evt | modeM0/AS1A03_078T01_9000001546cztM0_level2_quad_clean.evt |
| Size (bytes) | 10,792,146,240 | 1,552,561,920 |
| Size | 10.1 GB | 1.4 GB |
| Events in quadrant A | 77,780,526 | 9,671,238 |
| Events in quadrant B | 77,946,664 | 9,878,533 |
| Events in quadrant C | 58,115,912 | 9,943,640 |
| Events in quadrant D | 104,496,206 | 8,870,056 |
| Mode SS | |||
|---|---|---|---|
| Quadrant | BADHDUFLAG | Total packets | Discarded packets |
| A | 0 | 2584 | 0 |
| B | 0 | 2582 | 0 |
| C | 0 | 2588 | 0 |
| D | 0 | 2586 | 0 |
| Mode M0 | |||
|---|---|---|---|
| Quadrant | BADHDUFLAG | Total packets | Discarded packets |
| A | 0 | 316621 | 0 |
| B | 0 | 315751 | 0 |
| C | 0 | 261251 | 0 |
| D | 0 | 397180 | 0 |
| Mode M9 | |||
|---|---|---|---|
| Quadrant | BADHDUFLAG | Total packets | Discarded packets |
| A | 0 | 176 | 0 |
| B | 0 | 176 | 0 |
| C | 0 | 176 | 0 |
| D | 0 | 176 | 0 |
| Quadrant | Total seconds | Saturated seconds | Saturation percentage |
|---|---|---|---|
| A | 126382 | 5224 | 4.133500% |
| B | 126430 | 5835 | 4.615202% |
| C | 126524 | 1009 | 0.797477% |
| D | 125869 | 13490 | 10.717492% |
Noise dominated data is calculated using 1-second bins in cleaned event files. If a bin has >2000 counts, and if more than 50% of those come from <1% of pixels, then it is considered to be noise-dominated and hence unusable.
| Quadrant | # 1 sec bins | Bins with >0 counts | Bins with >2000 counts | High rate bins dominated by noise | Noise dominated (total time) | Noise dominated (detector-on time) | Marked lightcurve |
|---|---|---|---|---|---|---|---|
| A | 145086 | 126942 | 2927 | 2927 | 2.02% | 2.31% |  |
| B | 145086 | 126950 | 2450 | 2450 | 1.69% | 1.93% |  |
| C | 145086 | 127039 | 31 | 31 | 0.02% | 0.02% |  |
| D | 145086 | 126505 | 10526 | 10526 | 7.26% | 8.32% |  |
Top three noisy pixels from each quadrant. If the there are fewer than three noisy pixels in the level2.evt file, extra rows are filled as -1
| Pixel properties | Quadrant properties | ||||||
|---|---|---|---|---|---|---|---|
| Quadrant | DetID | PixID | Counts | Sigma | Mean | Median | Sigma |
| A | 15 | 239 | 17823976 | 5899.55 | 14977 | 14671 | 3018.8 |
| A | 15 | 174 | 579910 | 187.24 | 14977 | 14671 | 3018.8 |
| A | 14 | 254 | 512131 | 164.79 | 14977 | 14671 | 3018.8 |
| B | 4 | 239 | 15349153 | 5345.48 | 15057 | 14695 | 2868.7 |
| B | 4 | 81 | 1092846 | 375.84 | 15057 | 14695 | 2868.7 |
| B | 0 | 214 | 997840 | 342.72 | 15057 | 14695 | 2868.7 |
| C | 14 | 234 | 299798 | 82.53 | 14832 | 14895 | 3452.2 |
| C | 13 | 61 | 109530 | 27.41 | 14832 | 14895 | 3452.2 |
| C | 8 | 222 | 42988 | 8.14 | 14832 | 14895 | 3452.2 |
| D | 2 | 16 | 24587358 | 7322.41 | 13960 | 13586 | 3356.0 |
| D | 1 | 52 | 13614642 | 4052.8 | 13960 | 13586 | 3356.0 |
| D | 12 | 233 | 3283419 | 974.33 | 13960 | 13586 | 3356.0 |
Histogram calculated using DETX and DETY for each event in the final _common_clean file
| Quadrant A |  |
 |
Quadrant B |
|---|---|---|---|
| Quadrant D |  |
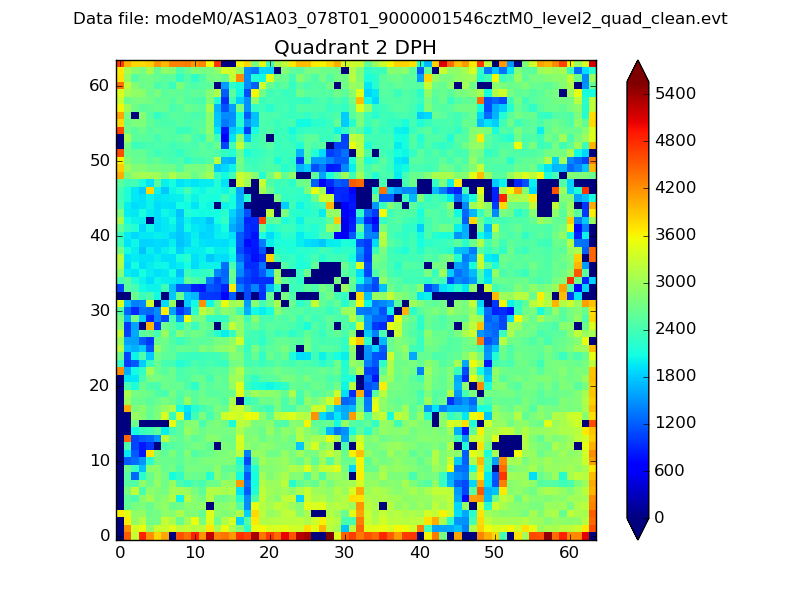 |
Quadrant C |
| Plot type | Count rate plots | Images |
|---|---|---|
| Comparison with Poisson distribution Blue bars denote a histogram of data divided into 1 sec bins. Red curve is a Poisson curve with rate = median count rate of data. |
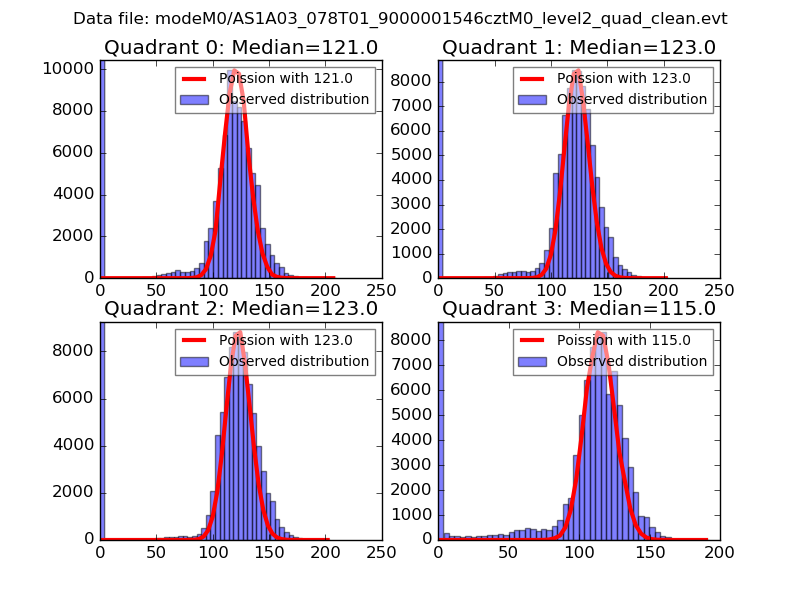 |
 |
| Quadrant-wise count rates Data is divided into 100 sec bins |
 |
|
| Module-wise count rates for Quadrant A Data is divided into 100 sec bins |
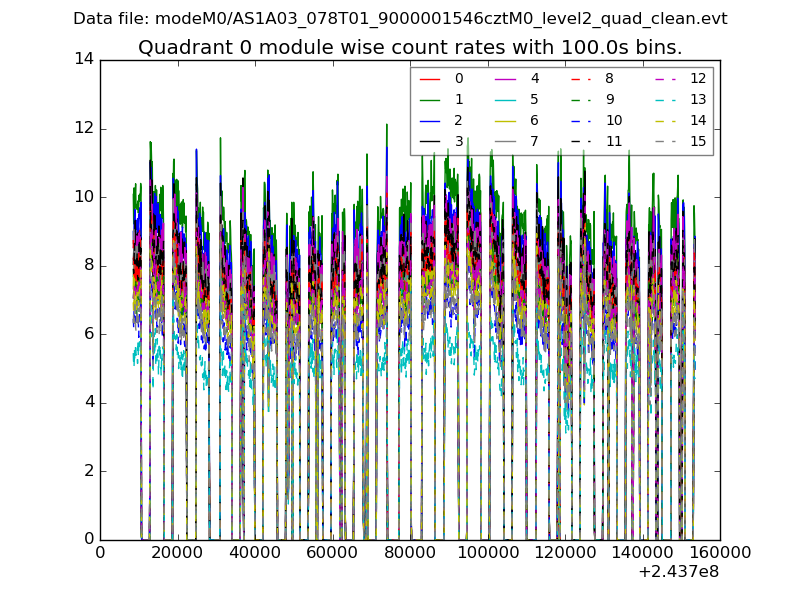 |
 |
| Module-wise count rates for Quadrant B Data is divided into 100 sec bins |
 |
 |
| Module-wise count rates for Quadrant C Data is divided into 100 sec bins |
 |
 |
| Module-wise count rates for Quadrant D Data is divided into 100 sec bins |
 |
 |
| Parameter | Plot |
|---|---|
| CZT HV Monitor |  |
| D_VDD |  |
| Temperature 1 |  |
| Veto HV Monitor |  |
| Veto LLD |  |
| Alpha Counter |  |
| _CPM_Rate |  |
| CZT Counter |  |
| +2.5 Volts monitor |  |
| +5 Volts monitor |  |
| _ROLL_ROT | 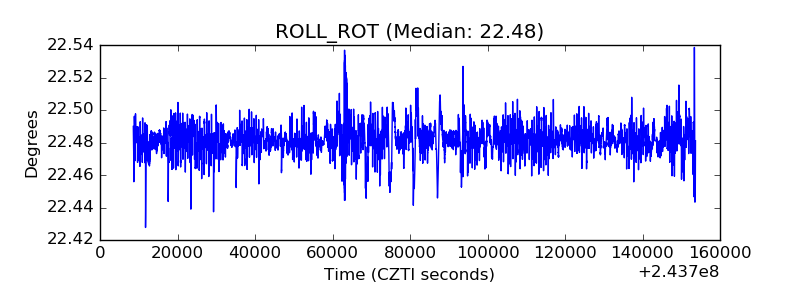 |
| _Roll_DEC |  |
| _Roll_RA | 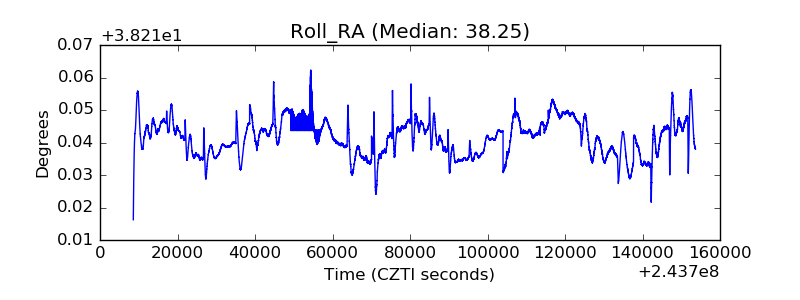 |
| Veto Counter | 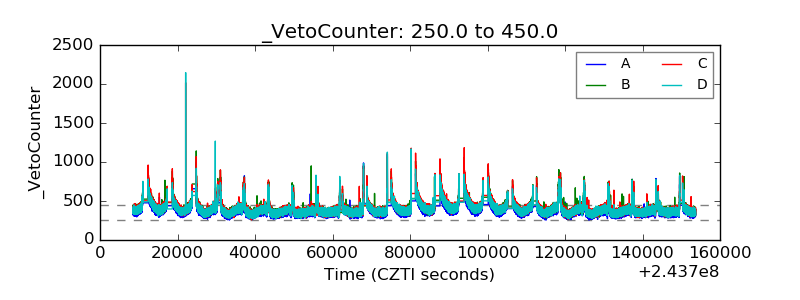 |