| Param | Original file | Final file |
|---|---|---|
| Filename | modeM0/AS1A03_053T01_9000001542cztM0_level2.evt | modeM0/AS1A03_053T01_9000001542cztM0_level2_quad_clean.evt |
| Size (bytes) | 1,293,330,240 | 191,445,120 |
| Size | 1.2 GB | 182.6 MB |
| Events in quadrant A | 7,350,158 | 1,224,122 |
| Events in quadrant B | 10,965,656 | 1,192,333 |
| Events in quadrant C | 7,045,348 | 1,213,864 |
| Events in quadrant D | 12,746,250 | 1,083,188 |
| Mode SS | |||
|---|---|---|---|
| Quadrant | BADHDUFLAG | Total packets | Discarded packets |
| A | 0 | 320 | 0 |
| B | 0 | 320 | 0 |
| C | 0 | 320 | 0 |
| D | 0 | 320 | 0 |
| Mode M0 | |||
|---|---|---|---|
| Quadrant | BADHDUFLAG | Total packets | Discarded packets |
| A | 0 | 32493 | 0 |
| B | 0 | 42870 | 0 |
| C | 0 | 32325 | 0 |
| D | 0 | 48516 | 0 |
| Mode M9 | |||
|---|---|---|---|
| Quadrant | BADHDUFLAG | Total packets | Discarded packets |
| A | 0 | 11 | 0 |
| B | 0 | 11 | 0 |
| C | 0 | 11 | 0 |
| D | 0 | 11 | 0 |
| Quadrant | Total seconds | Saturated seconds | Saturation percentage |
|---|---|---|---|
| A | 15715 | 388 | 2.468979% |
| B | 15717 | 1157 | 7.361456% |
| C | 15714 | 331 | 2.106402% |
| D | 15717 | 1423 | 9.053891% |
Noise dominated data is calculated using 1-second bins in cleaned event files. If a bin has >2000 counts, and if more than 50% of those come from <1% of pixels, then it is considered to be noise-dominated and hence unusable.
| Quadrant | # 1 sec bins | Bins with >0 counts | Bins with >2000 counts | High rate bins dominated by noise | Noise dominated (total time) | Noise dominated (detector-on time) | Marked lightcurve |
|---|---|---|---|---|---|---|---|
| A | 16797 | 15719 | 1 | 1 | 0.01% | 0.01% |  |
| B | 16797 | 15718 | 534 | 534 | 3.18% | 3.40% |  |
| C | 16797 | 15719 | 3 | 3 | 0.02% | 0.02% |  |
| D | 16797 | 15718 | 1064 | 1064 | 6.33% | 6.77% |  |
Top three noisy pixels from each quadrant. If the there are fewer than three noisy pixels in the level2.evt file, extra rows are filled as -1
| Pixel properties | Quadrant properties | ||||||
|---|---|---|---|---|---|---|---|
| Quadrant | DetID | PixID | Counts | Sigma | Mean | Median | Sigma |
| A | 1 | 162 | 61128 | 157.79 | 1856 | 1818 | 375.9 |
| A | 15 | 174 | 53047 | 136.29 | 1856 | 1818 | 375.9 |
| A | 14 | 254 | 21707 | 52.91 | 1856 | 1818 | 375.9 |
| B | 4 | 239 | 3131576 | 9001.34 | 1823 | 1781 | 347.7 |
| B | 4 | 81 | 290238 | 829.61 | 1823 | 1781 | 347.7 |
| B | 0 | 85 | 138026 | 391.84 | 1823 | 1781 | 347.7 |
| C | 14 | 234 | 22168 | 48.63 | 1799 | 1806 | 418.7 |
| C | 13 | 61 | 13545 | 28.03 | 1799 | 1806 | 418.7 |
| C | 8 | 222 | 6320 | 10.78 | 1799 | 1806 | 418.7 |
| D | 10 | 199 | 2912218 | 6918.45 | 1739 | 1687 | 420.7 |
| D | 2 | 16 | 1022007 | 2425.34 | 1739 | 1687 | 420.7 |
| D | 1 | 52 | 1016040 | 2411.16 | 1739 | 1687 | 420.7 |
Histogram calculated using DETX and DETY for each event in the final _common_clean file
| Quadrant A |  |
 |
Quadrant B |
|---|---|---|---|
| Quadrant D |  |
 |
Quadrant C |
| Plot type | Count rate plots | Images |
|---|---|---|
| Comparison with Poisson distribution Blue bars denote a histogram of data divided into 1 sec bins. Red curve is a Poisson curve with rate = median count rate of data. |
 |
 |
| Quadrant-wise count rates Data is divided into 100 sec bins |
 |
|
| Module-wise count rates for Quadrant A Data is divided into 100 sec bins |
 |
 |
| Module-wise count rates for Quadrant B Data is divided into 100 sec bins |
 |
 |
| Module-wise count rates for Quadrant C Data is divided into 100 sec bins |
 |
 |
| Module-wise count rates for Quadrant D Data is divided into 100 sec bins |
 |
 |
| Parameter | Plot |
|---|---|
| CZT HV Monitor | 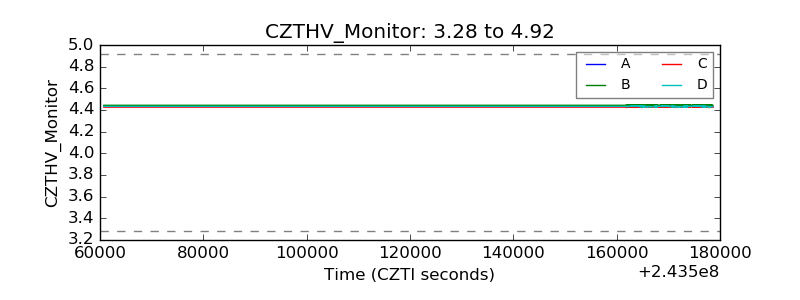 |
| D_VDD |  |
| Temperature 1 |  |
| Veto HV Monitor | 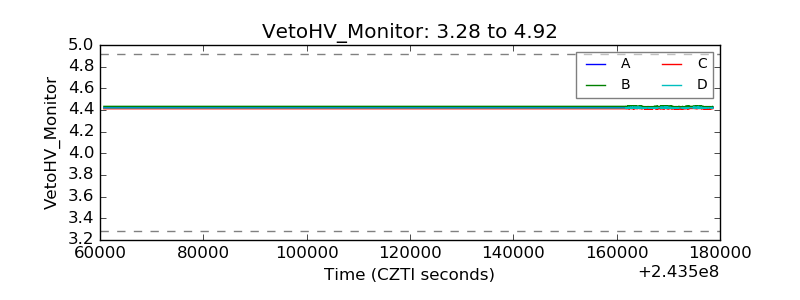 |
| Veto LLD |  |
| Alpha Counter |  |
| _CPM_Rate | 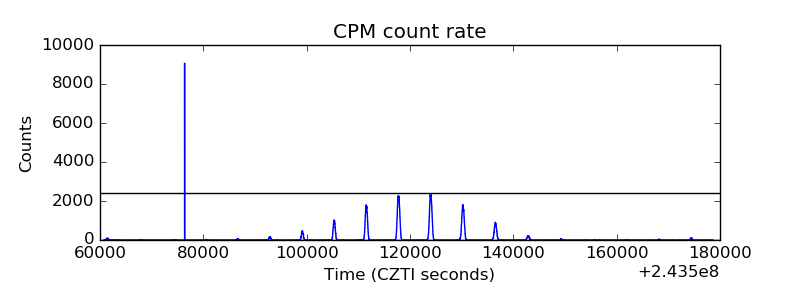 |
| CZT Counter |  |
| +2.5 Volts monitor |  |
| +5 Volts monitor |  |
| _ROLL_ROT |  |
| _Roll_DEC | 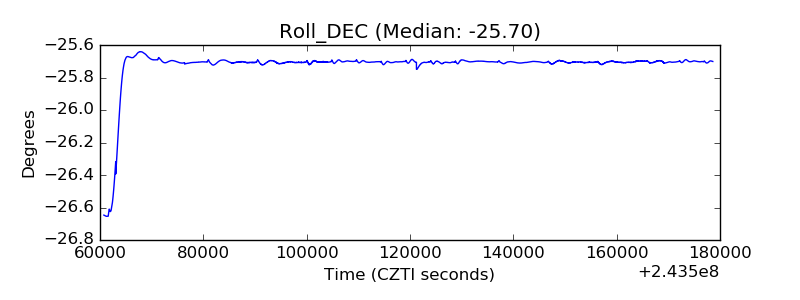 |
| _Roll_RA |  |
| Veto Counter | 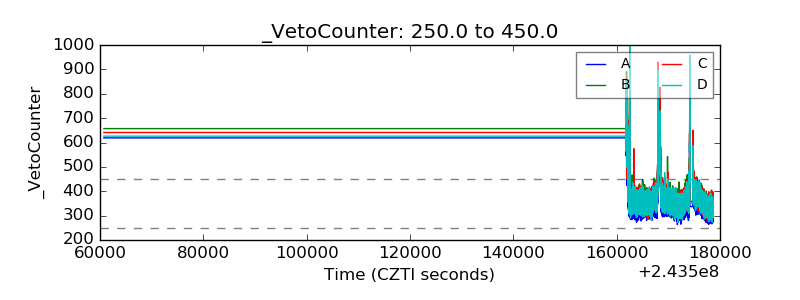 |