| Param | Original file | Final file |
|---|---|---|
| Filename | modeM0/AS1G07_076T01_9000001538cztM0_level2.evt | modeM0/AS1G07_076T01_9000001538cztM0_level2_quad_clean.evt |
| Size (bytes) | 1,303,462,080 | 201,568,320 |
| Size | 1.2 GB | 192.2 MB |
| Events in quadrant A | 9,072,435 | 1,216,418 |
| Events in quadrant B | 10,745,806 | 1,247,745 |
| Events in quadrant C | 8,043,296 | 1,262,466 |
| Events in quadrant D | 10,461,138 | 1,201,240 |
| Mode M0 | |||
|---|---|---|---|
| Quadrant | BADHDUFLAG | Total packets | Discarded packets |
| A | 0 | 38774 | 0 |
| B | 0 | 43144 | 0 |
| C | 0 | 35981 | 0 |
| D | 0 | 42519 | 0 |
| Mode M9 | |||
|---|---|---|---|
| Quadrant | BADHDUFLAG | Total packets | Discarded packets |
| A | 0 | 3 | 0 |
| B | 0 | 3 | 0 |
| C | 0 | 3 | 0 |
| D | 0 | 3 | 0 |
| Mode SS | |||
|---|---|---|---|
| Quadrant | BADHDUFLAG | Total packets | Discarded packets |
| A | 0 | 346 | 0 |
| B | 0 | 344 | 0 |
| C | 0 | 344 | 0 |
| D | 0 | 346 | 0 |
| Quadrant | Total seconds | Saturated seconds | Saturation percentage |
|---|---|---|---|
| A | 17058 | 717 | 4.203306% |
| B | 17058 | 972 | 5.698206% |
| C | 17050 | 291 | 1.706745% |
| D | 17058 | 296 | 1.735256% |
Noise dominated data is calculated using 1-second bins in cleaned event files. If a bin has >2000 counts, and if more than 50% of those come from <1% of pixels, then it is considered to be noise-dominated and hence unusable.
| Quadrant | # 1 sec bins | Bins with >0 counts | Bins with >2000 counts | High rate bins dominated by noise | Noise dominated (total time) | Noise dominated (detector-on time) | Marked lightcurve |
|---|---|---|---|---|---|---|---|
| A | 17483 | 17078 | 281 | 281 | 1.61% | 1.65% |  |
| B | 17483 | 17079 | 417 | 417 | 2.39% | 2.44% |  |
| C | 17483 | 17080 | 76 | 76 | 0.43% | 0.44% |  |
| D | 17483 | 17079 | 64 | 64 | 0.37% | 0.37% | 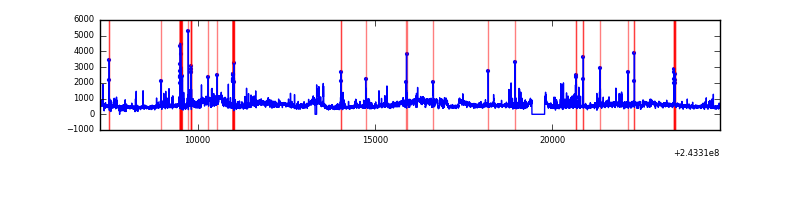 |
Top three noisy pixels from each quadrant. If the there are fewer than three noisy pixels in the level2.evt file, extra rows are filled as -1
| Pixel properties | Quadrant properties | ||||||
|---|---|---|---|---|---|---|---|
| Quadrant | DetID | PixID | Counts | Sigma | Mean | Median | Sigma |
| A | 15 | 223 | 744712 | 1866.75 | 1940 | 1892 | 397.9 |
| A | 15 | 174 | 357712 | 894.2 | 1940 | 1892 | 397.9 |
| A | 15 | 239 | 319166 | 797.33 | 1940 | 1892 | 397.9 |
| B | 4 | 239 | 2414928 | 6510.59 | 1945 | 1894 | 370.6 |
| B | 15 | 204 | 394331 | 1058.83 | 1945 | 1894 | 370.6 |
| B | 4 | 81 | 103601 | 274.41 | 1945 | 1894 | 370.6 |
| C | 4 | 254 | 483212 | 1089.28 | 1912 | 1920 | 441.8 |
| C | 14 | 234 | 57169 | 125.04 | 1912 | 1920 | 441.8 |
| C | 4 | 175 | 15940 | 31.73 | 1912 | 1920 | 441.8 |
| D | 1 | 20 | 2288672 | 4984.26 | 1899 | 1842 | 458.8 |
| D | 8 | 195 | 259785 | 562.2 | 1899 | 1842 | 458.8 |
| D | 13 | 249 | 237772 | 514.22 | 1899 | 1842 | 458.8 |
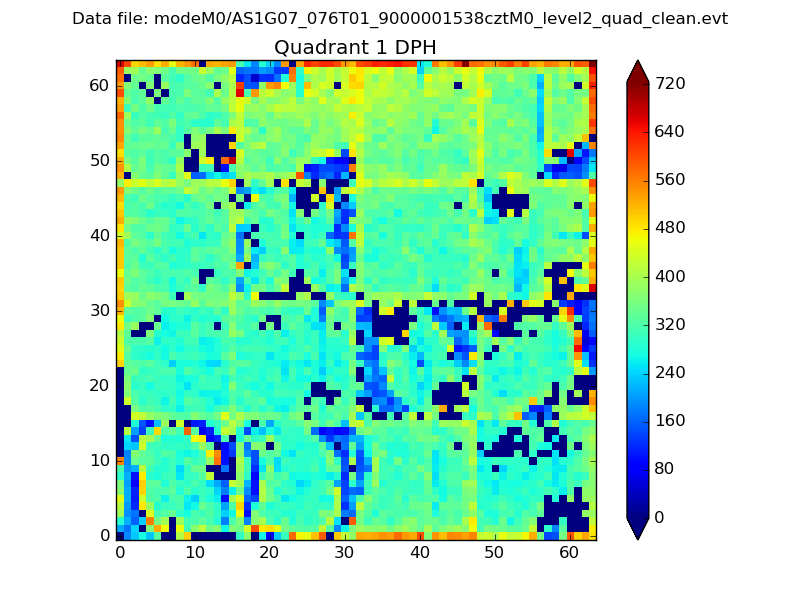
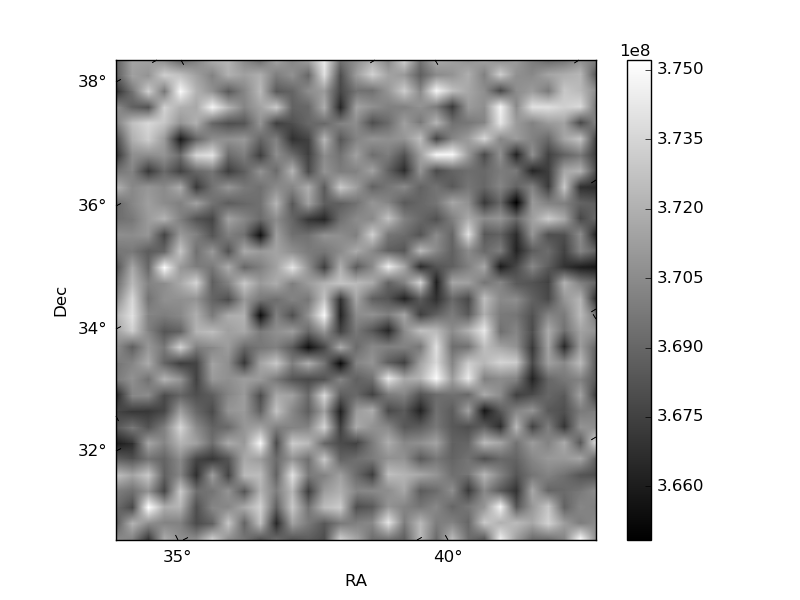
Histogram calculated using DETX and DETY for each event in the final _common_clean file
| Quadrant A |  |
 |
Quadrant B |
|---|---|---|---|
| Quadrant D | 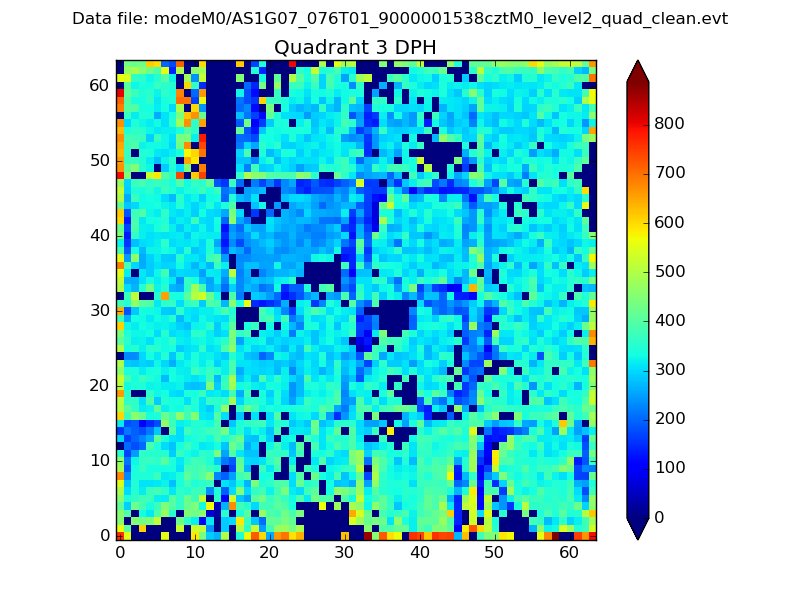 |
 |
Quadrant C |
| Plot type | Count rate plots | Images |
|---|---|---|
| Comparison with Poisson distribution Blue bars denote a histogram of data divided into 1 sec bins. Red curve is a Poisson curve with rate = median count rate of data. |
 |
 |
| Quadrant-wise count rates Data is divided into 100 sec bins |
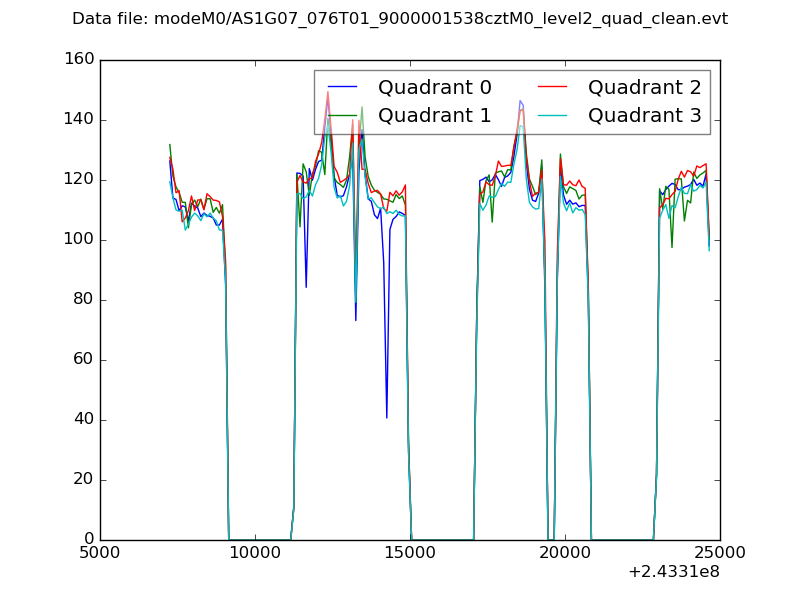 |
|
| Module-wise count rates for Quadrant A Data is divided into 100 sec bins |
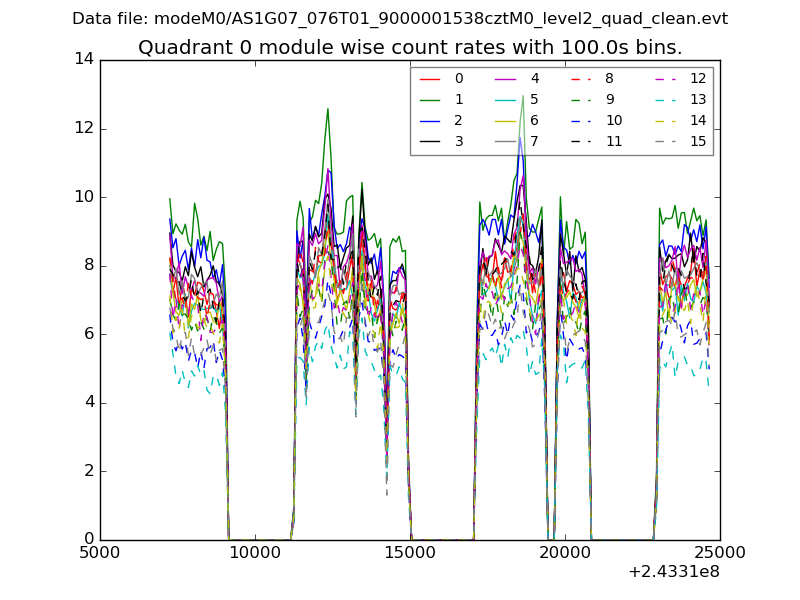 |
 |
| Module-wise count rates for Quadrant B Data is divided into 100 sec bins |
 |
 |
| Module-wise count rates for Quadrant C Data is divided into 100 sec bins |
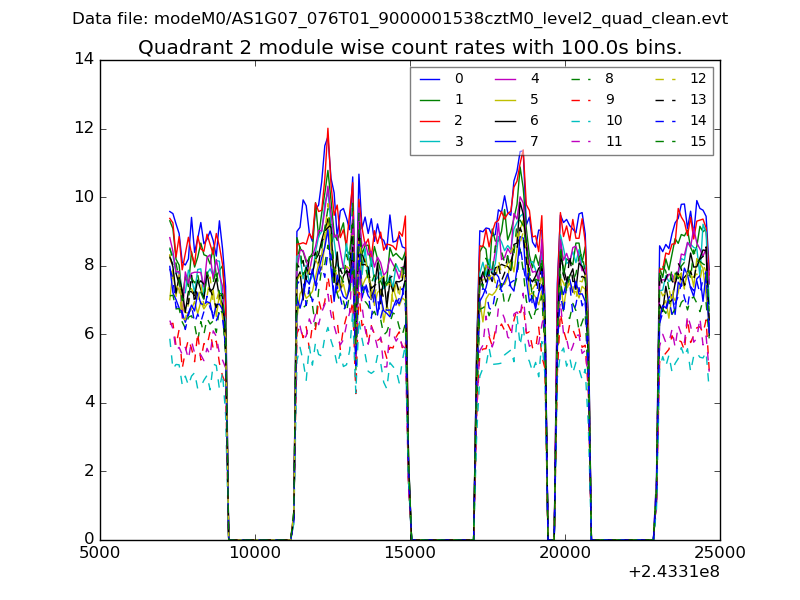 |
 |
| Module-wise count rates for Quadrant D Data is divided into 100 sec bins |
 |
 |
| Parameter | Plot |
|---|---|
| CZT HV Monitor |  |
| D_VDD |  |
| Temperature 1 | 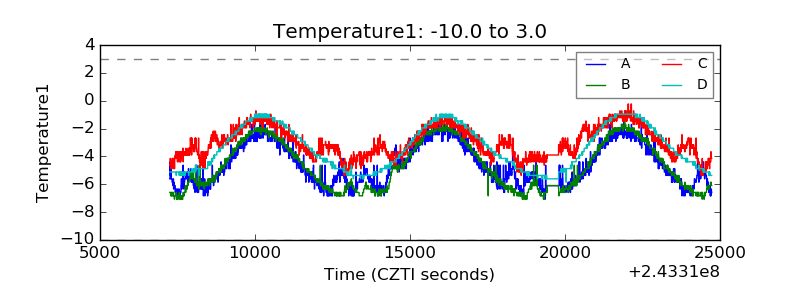 |
| Veto HV Monitor |  |
| Veto LLD |  |
| Alpha Counter | 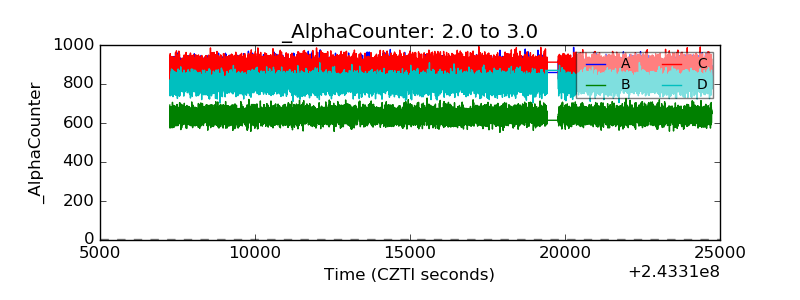 |
| _CPM_Rate |  |
| CZT Counter |  |
| +2.5 Volts monitor |  |
| +5 Volts monitor |  |
| _ROLL_ROT |  |
| _Roll_DEC | 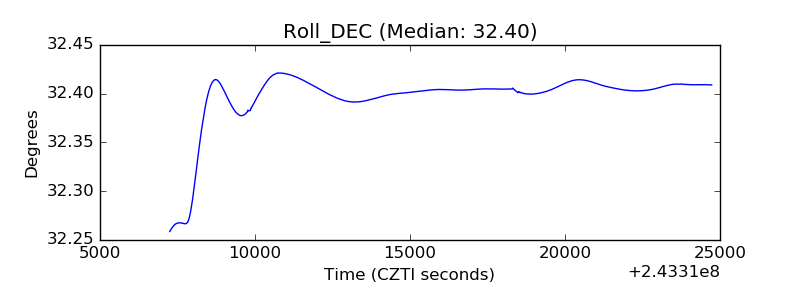 |
| _Roll_RA |  |
| Veto Counter | 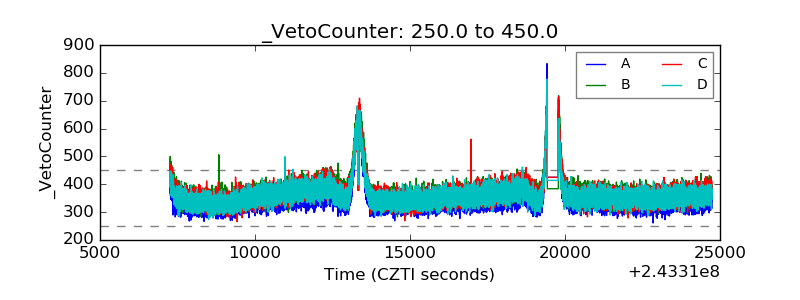 |