| Param | Original file | Final file |
|---|---|---|
| Filename | modeM0/AS1G07_046T01_9000001534cztM0_level2.evt | modeM0/AS1G07_046T01_9000001534cztM0_level2_quad_clean.evt |
| Size (bytes) | 3,312,414,720 | 506,448,000 |
| Size | 3.1 GB | 483.0 MB |
| Events in quadrant A | 20,533,880 | 3,195,156 |
| Events in quadrant B | 30,572,792 | 3,101,561 |
| Events in quadrant C | 19,526,869 | 3,168,212 |
| Events in quadrant D | 26,832,367 | 2,969,074 |
| Mode M9 | |||
|---|---|---|---|
| Quadrant | BADHDUFLAG | Total packets | Discarded packets |
| A | 0 | 88 | 0 |
| B | 0 | 88 | 0 |
| C | 0 | 88 | 0 |
| D | 0 | 88 | 0 |
| Mode SS | |||
|---|---|---|---|
| Quadrant | BADHDUFLAG | Total packets | Discarded packets |
| A | 0 | 858 | 0 |
| B | 0 | 858 | 0 |
| C | 0 | 858 | 0 |
| D | 0 | 858 | 0 |
| Mode M0 | |||
|---|---|---|---|
| Quadrant | BADHDUFLAG | Total packets | Discarded packets |
| A | 0 | 88736 | 0 |
| B | 0 | 118141 | 0 |
| C | 0 | 86882 | 0 |
| D | 0 | 108086 | 0 |
| Quadrant | Total seconds | Saturated seconds | Saturation percentage |
|---|---|---|---|
| A | 42326 | 346 | 0.817464% |
| B | 42326 | 3173 | 7.496574% |
| C | 42326 | 185 | 0.437084% |
| D | 42326 | 411 | 0.971034% |
Noise dominated data is calculated using 1-second bins in cleaned event files. If a bin has >2000 counts, and if more than 50% of those come from <1% of pixels, then it is considered to be noise-dominated and hence unusable.
| Quadrant | # 1 sec bins | Bins with >0 counts | Bins with >2000 counts | High rate bins dominated by noise | Noise dominated (total time) | Noise dominated (detector-on time) | Marked lightcurve |
|---|---|---|---|---|---|---|---|
| A | 56313 | 42334 | 3 | 3 | 0.01% | 0.01% |  |
| B | 56313 | 42335 | 2095 | 2095 | 3.72% | 4.95% |  |
| C | 56313 | 42334 | 12 | 12 | 0.02% | 0.03% |  |
| D | 56313 | 42334 | 136 | 136 | 0.24% | 0.32% |  |
Top three noisy pixels from each quadrant. If the there are fewer than three noisy pixels in the level2.evt file, extra rows are filled as -1
| Pixel properties | Quadrant properties | ||||||
|---|---|---|---|---|---|---|---|
| Quadrant | DetID | PixID | Counts | Sigma | Mean | Median | Sigma |
| A | 13 | 251 | 637299 | 615.69 | 5102 | 4992 | 1027.0 |
| A | 1 | 162 | 143150 | 134.53 | 5102 | 4992 | 1027.0 |
| A | 0 | 226 | 46306 | 40.23 | 5102 | 4992 | 1027.0 |
| B | 4 | 239 | 9457217 | 9964.26 | 5021 | 4905 | 948.6 |
| B | 0 | 219 | 766936 | 803.3 | 5021 | 4905 | 948.6 |
| B | 11 | 51 | 245020 | 253.12 | 5021 | 4905 | 948.6 |
| C | 4 | 254 | 75856 | 61.85 | 4953 | 4983 | 1146.0 |
| C | 4 | 175 | 70319 | 57.01 | 4953 | 4983 | 1146.0 |
| C | 14 | 234 | 43919 | 33.98 | 4953 | 4983 | 1146.0 |
| D | 2 | 16 | 5123862 | 4358.04 | 4886 | 4755 | 1174.6 |
| D | 8 | 195 | 1980757 | 1682.23 | 4886 | 4755 | 1174.6 |
| D | 1 | 52 | 608553 | 514.03 | 4886 | 4755 | 1174.6 |
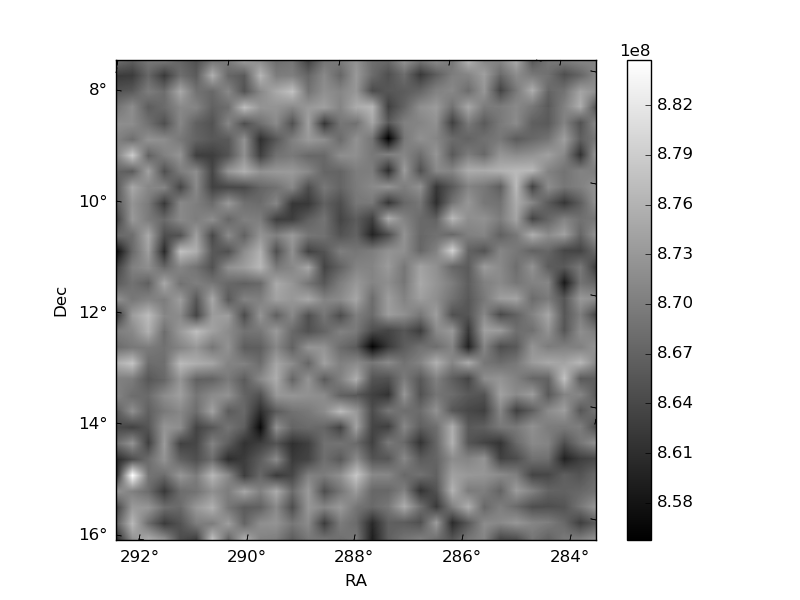
Histogram calculated using DETX and DETY for each event in the final _common_clean file
| Quadrant A |  |
 |
Quadrant B |
|---|---|---|---|
| Quadrant D |  |
 |
Quadrant C |
| Plot type | Count rate plots | Images |
|---|---|---|
| Comparison with Poisson distribution Blue bars denote a histogram of data divided into 1 sec bins. Red curve is a Poisson curve with rate = median count rate of data. |
 |
 |
| Quadrant-wise count rates Data is divided into 100 sec bins |
 |
|
| Module-wise count rates for Quadrant A Data is divided into 100 sec bins |
 |
 |
| Module-wise count rates for Quadrant B Data is divided into 100 sec bins |
 |
 |
| Module-wise count rates for Quadrant C Data is divided into 100 sec bins |
 |
 |
| Module-wise count rates for Quadrant D Data is divided into 100 sec bins |
 |
 |
| Parameter | Plot |
|---|---|
| CZT HV Monitor | 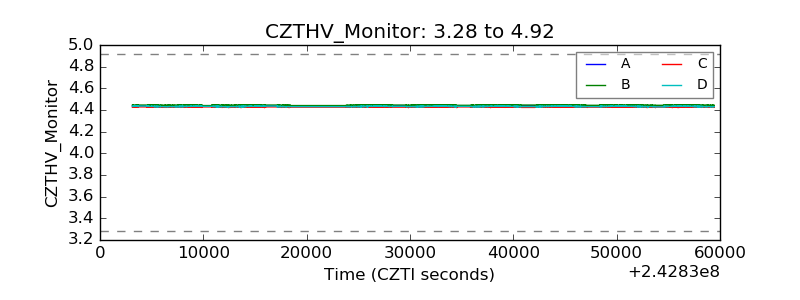 |
| D_VDD |  |
| Temperature 1 |  |
| Veto HV Monitor |  |
| Veto LLD |  |
| Alpha Counter |  |
| _CPM_Rate |  |
| CZT Counter |  |
| +2.5 Volts monitor |  |
| +5 Volts monitor |  |
| _ROLL_ROT |  |
| _Roll_DEC |  |
| _Roll_RA |  |
| Veto Counter | 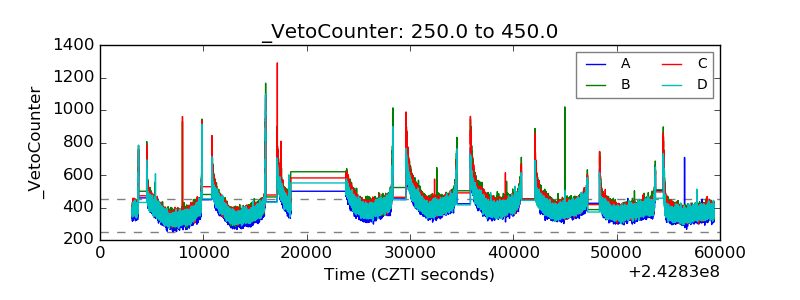 |