| Param | Original file | Final file |
|---|---|---|
| Filename | modeM0/AS1G07_004T01_9000001532cztM0_level2.evt | modeM0/AS1G07_004T01_9000001532cztM0_level2_quad_clean.evt |
| Size (bytes) | 6,889,691,520 | 1,181,252,160 |
| Size | 6.4 GB | 1.1 GB |
| Events in quadrant A | 42,731,302 | 7,325,750 |
| Events in quadrant B | 59,452,484 | 7,381,633 |
| Events in quadrant C | 41,624,942 | 7,604,828 |
| Events in quadrant D | 58,626,639 | 7,141,585 |
| Mode M9 | |||
|---|---|---|---|
| Quadrant | BADHDUFLAG | Total packets | Discarded packets |
| A | 0 | 122 | 0 |
| B | 0 | 122 | 0 |
| C | 0 | 122 | 0 |
| D | 0 | 122 | 0 |
| Mode SS | |||
|---|---|---|---|
| Quadrant | BADHDUFLAG | Total packets | Discarded packets |
| A | 0 | 1878 | 0 |
| B | 0 | 1884 | 0 |
| C | 0 | 1880 | 0 |
| D | 0 | 1876 | 0 |
| Mode M0 | |||
|---|---|---|---|
| Quadrant | BADHDUFLAG | Total packets | Discarded packets |
| A | 0 | 190727 | 0 |
| B | 0 | 238853 | 0 |
| C | 0 | 189355 | 0 |
| D | 0 | 234838 | 0 |
| Quadrant | Total seconds | Saturated seconds | Saturation percentage |
|---|---|---|---|
| A | 92265 | 1309 | 1.418740% |
| B | 92260 | 5752 | 6.234555% |
| C | 92245 | 852 | 0.923627% |
| D | 92240 | 2682 | 2.907632% |
Noise dominated data is calculated using 1-second bins in cleaned event files. If a bin has >2000 counts, and if more than 50% of those come from <1% of pixels, then it is considered to be noise-dominated and hence unusable.
| Quadrant | # 1 sec bins | Bins with >0 counts | Bins with >2000 counts | High rate bins dominated by noise | Noise dominated (total time) | Noise dominated (detector-on time) | Marked lightcurve |
|---|---|---|---|---|---|---|---|
| A | 104942 | 92624 | 34 | 34 | 0.03% | 0.04% |  |
| B | 104942 | 92598 | 3116 | 3116 | 2.97% | 3.37% | 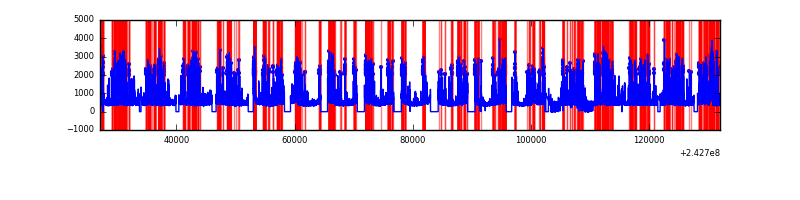 |
| C | 104942 | 92620 | 19 | 19 | 0.02% | 0.02% |  |
| D | 104942 | 92612 | 1597 | 1597 | 1.52% | 1.72% |  |
Top three noisy pixels from each quadrant. If the there are fewer than three noisy pixels in the level2.evt file, extra rows are filled as -1
| Pixel properties | Quadrant properties | ||||||
|---|---|---|---|---|---|---|---|
| Quadrant | DetID | PixID | Counts | Sigma | Mean | Median | Sigma |
| A | 13 | 251 | 556932 | 252.68 | 10759 | 10531 | 2162.4 |
| A | 1 | 162 | 351166 | 157.53 | 10759 | 10531 | 2162.4 |
| A | 15 | 174 | 107253 | 44.73 | 10759 | 10531 | 2162.4 |
| B | 4 | 239 | 16144716 | 8025.42 | 10668 | 10400 | 2010.4 |
| B | 0 | 214 | 520368 | 253.66 | 10668 | 10400 | 2010.4 |
| B | 11 | 51 | 495755 | 241.42 | 10668 | 10400 | 2010.4 |
| C | 14 | 234 | 232235 | 91.23 | 10592 | 10644 | 2429.0 |
| C | 13 | 61 | 79054 | 28.16 | 10592 | 10644 | 2429.0 |
| C | 4 | 175 | 54658 | 18.12 | 10592 | 10644 | 2429.0 |
| D | 2 | 16 | 7246646 | 2927.15 | 10400 | 10115 | 2472.2 |
| D | 1 | 52 | 4920164 | 1986.1 | 10400 | 10115 | 2472.2 |
| D | 8 | 195 | 4633003 | 1869.94 | 10400 | 10115 | 2472.2 |
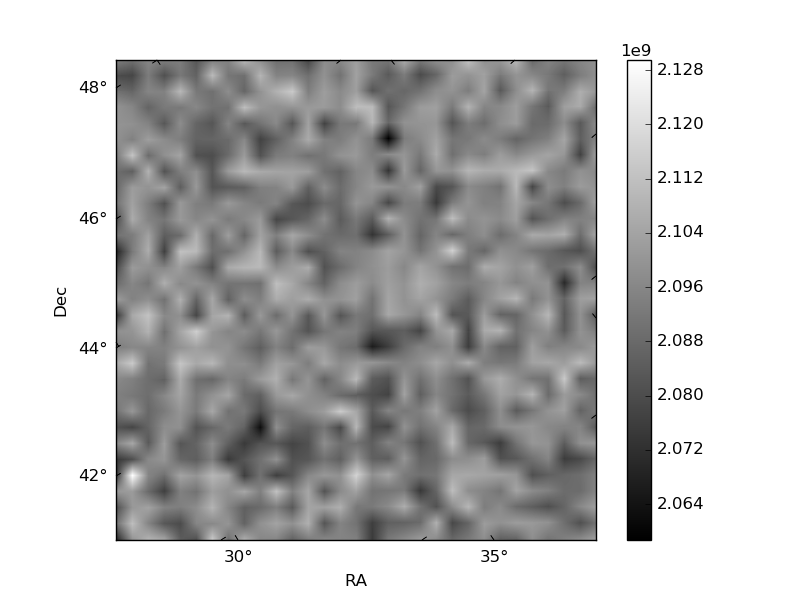
Histogram calculated using DETX and DETY for each event in the final _common_clean file
| Quadrant A |  |
 |
Quadrant B |
|---|---|---|---|
| Quadrant D |  |
 |
Quadrant C |
| Plot type | Count rate plots | Images |
|---|---|---|
| Comparison with Poisson distribution Blue bars denote a histogram of data divided into 1 sec bins. Red curve is a Poisson curve with rate = median count rate of data. |
 |
 |
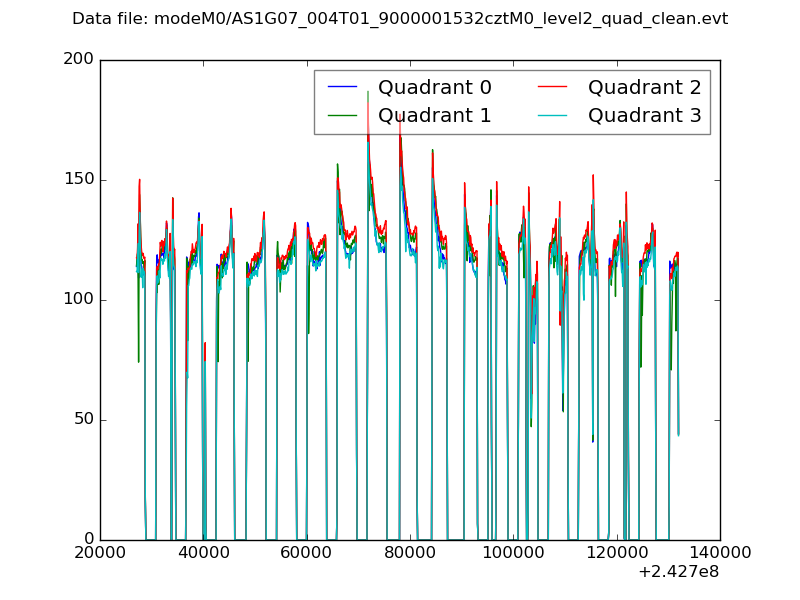
| Quadrant-wise count rates Data is divided into 100 sec bins |
 |
|
| Module-wise count rates for Quadrant A Data is divided into 100 sec bins |
 |
 |
| Module-wise count rates for Quadrant B Data is divided into 100 sec bins |
 |
 |
| Module-wise count rates for Quadrant C Data is divided into 100 sec bins |
 |
 |
| Module-wise count rates for Quadrant D Data is divided into 100 sec bins |
 |
 |
| Parameter | Plot |
|---|---|
| CZT HV Monitor |  |
| D_VDD | 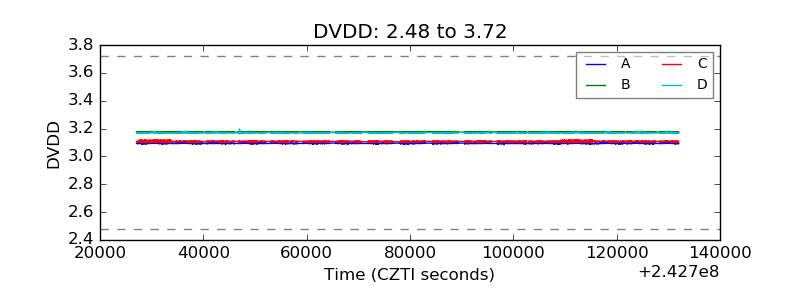 |
| Temperature 1 | 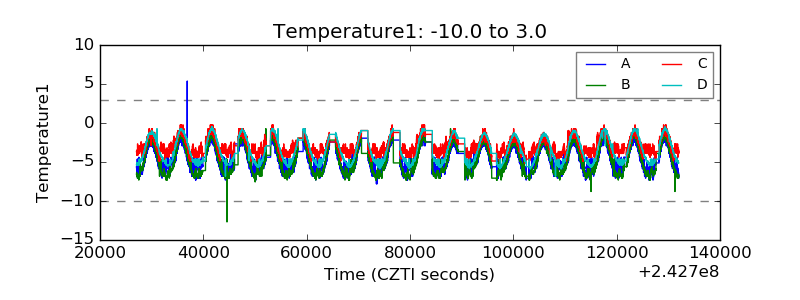 |
| Veto HV Monitor |  |
| Veto LLD |  |
| Alpha Counter |  |
| _CPM_Rate |  |
| CZT Counter |  |
| +2.5 Volts monitor |  |
| +5 Volts monitor |  |
| _ROLL_ROT |  |
| _Roll_DEC | 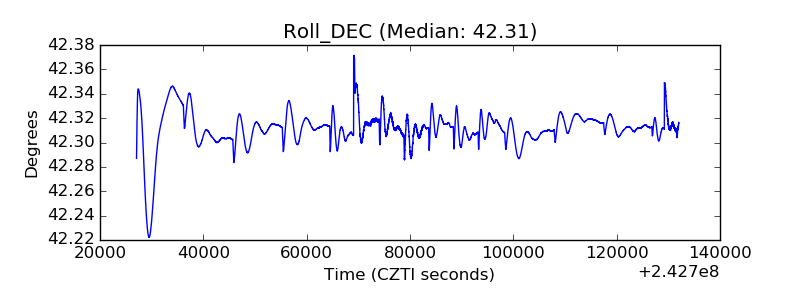 |
| _Roll_RA |  |
| Veto Counter |  |