| Param | Original file | Final file |
|---|---|---|
| Filename | modeM0/AS1G07_079T01_9000001528cztM0_level2.evt | modeM0/AS1G07_079T01_9000001528cztM0_level2_quad_clean.evt |
| Size (bytes) | 1,162,509,120 | 173,652,480 |
| Size | 1.1 GB | 165.6 MB |
| Events in quadrant A | 8,150,019 | 1,047,093 |
| Events in quadrant B | 10,001,300 | 1,064,563 |
| Events in quadrant C | 6,758,200 | 1,075,342 |
| Events in quadrant D | 9,265,206 | 1,018,146 |
| Mode SS | |||
|---|---|---|---|
| Quadrant | BADHDUFLAG | Total packets | Discarded packets |
| A | 0 | 314 | 0 |
| B | 0 | 314 | 0 |
| C | 0 | 314 | 0 |
| D | 0 | 314 | 0 |
| Mode M0 | |||
|---|---|---|---|
| Quadrant | BADHDUFLAG | Total packets | Discarded packets |
| A | 0 | 34646 | 0 |
| B | 0 | 39845 | 0 |
| C | 0 | 31185 | 0 |
| D | 0 | 37401 | 0 |
| Mode M9 | |||
|---|---|---|---|
| Quadrant | BADHDUFLAG | Total packets | Discarded packets |
| A | 0 | 16 | 0 |
| B | 0 | 16 | 0 |
| C | 0 | 16 | 0 |
| D | 0 | 16 | 0 |
| Quadrant | Total seconds | Saturated seconds | Saturation percentage |
|---|---|---|---|
| A | 15259 | 427 | 2.798349% |
| B | 15259 | 992 | 6.501081% |
| C | 15259 | 241 | 1.579396% |
| D | 15259 | 309 | 2.025034% |
Noise dominated data is calculated using 1-second bins in cleaned event files. If a bin has >2000 counts, and if more than 50% of those come from <1% of pixels, then it is considered to be noise-dominated and hence unusable.
| Quadrant | # 1 sec bins | Bins with >0 counts | Bins with >2000 counts | High rate bins dominated by noise | Noise dominated (total time) | Noise dominated (detector-on time) | Marked lightcurve |
|---|---|---|---|---|---|---|---|
| A | 16934 | 15262 | 117 | 117 | 0.69% | 0.77% |  |
| B | 16934 | 15262 | 505 | 505 | 2.98% | 3.31% |  |
| C | 16934 | 15262 | 2 | 2 | 0.01% | 0.01% | 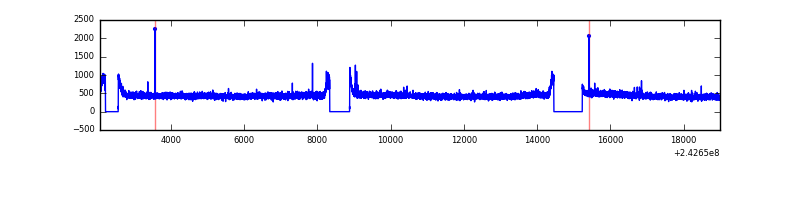 |
| D | 16934 | 15262 | 33 | 33 | 0.19% | 0.22% |  |
Top three noisy pixels from each quadrant. If the there are fewer than three noisy pixels in the level2.evt file, extra rows are filled as -1
| Pixel properties | Quadrant properties | ||||||
|---|---|---|---|---|---|---|---|
| Quadrant | DetID | PixID | Counts | Sigma | Mean | Median | Sigma |
| A | 15 | 239 | 1249244 | 3484.07 | 1758 | 1715 | 358.1 |
| A | 1 | 162 | 45655 | 122.71 | 1758 | 1715 | 358.1 |
| A | 8 | 5 | 25281 | 65.81 | 1758 | 1715 | 358.1 |
| B | 4 | 239 | 2580648 | 7670.55 | 1746 | 1703 | 336.2 |
| B | 11 | 51 | 324449 | 959.94 | 1746 | 1703 | 336.2 |
| B | 0 | 214 | 84397 | 245.96 | 1746 | 1703 | 336.2 |
| C | 14 | 234 | 13250 | 28.56 | 1729 | 1738 | 403.1 |
| C | 13 | 61 | 12836 | 27.53 | 1729 | 1738 | 403.1 |
| C | 1 | 3 | 5483 | 9.29 | 1729 | 1738 | 403.1 |
| D | 2 | 16 | 1528836 | 3657.39 | 1712 | 1664 | 417.6 |
| D | 8 | 195 | 798505 | 1908.34 | 1712 | 1664 | 417.6 |
| D | 1 | 52 | 172140 | 408.27 | 1712 | 1664 | 417.6 |
Histogram calculated using DETX and DETY for each event in the final _common_clean file
| Quadrant A | 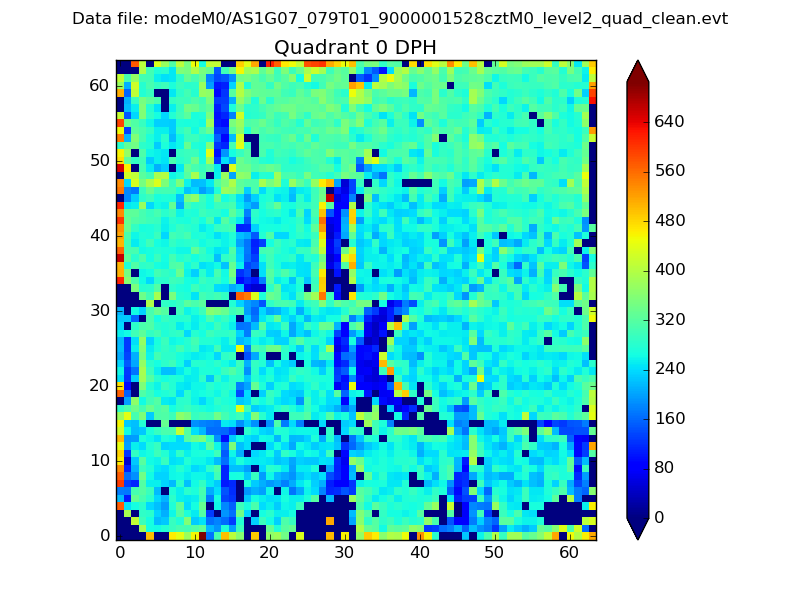 |
 |
Quadrant B |
|---|---|---|---|
| Quadrant D |  |
 |
Quadrant C |
| Plot type | Count rate plots | Images |
|---|---|---|
| Comparison with Poisson distribution Blue bars denote a histogram of data divided into 1 sec bins. Red curve is a Poisson curve with rate = median count rate of data. |
 |
 |
| Quadrant-wise count rates Data is divided into 100 sec bins |
 |
|
| Module-wise count rates for Quadrant A Data is divided into 100 sec bins |
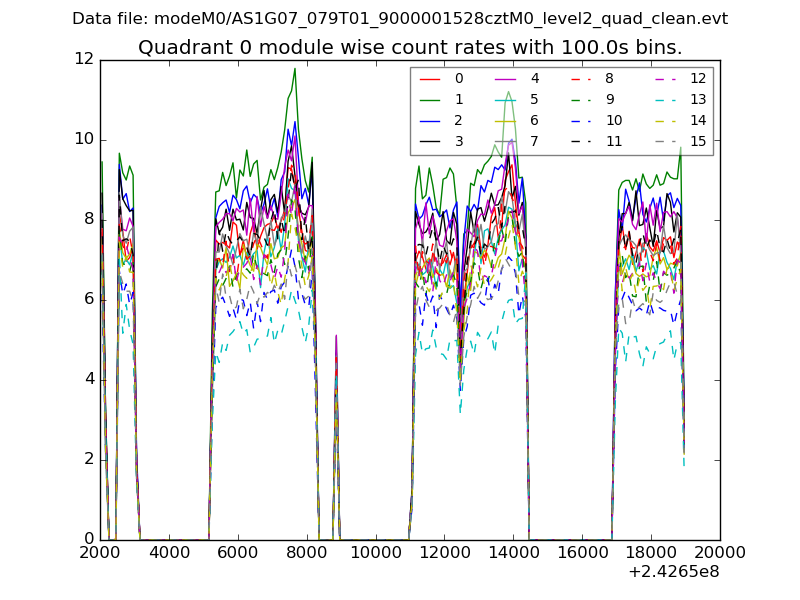 |
 |
| Module-wise count rates for Quadrant B Data is divided into 100 sec bins |
 |
 |
| Module-wise count rates for Quadrant C Data is divided into 100 sec bins |
 |
 |
| Module-wise count rates for Quadrant D Data is divided into 100 sec bins |
 |
 |
| Parameter | Plot |
|---|---|
| CZT HV Monitor |  |
| D_VDD |  |
| Temperature 1 |  |
| Veto HV Monitor |  |
| Veto LLD |  |
| Alpha Counter |  |
| _CPM_Rate |  |
| CZT Counter |  |
| +2.5 Volts monitor |  |
| +5 Volts monitor |  |
| _ROLL_ROT |  |
| _Roll_DEC |  |
| _Roll_RA |  |
| Veto Counter |  |