| Param | Original file | Final file |
|---|---|---|
| Filename | modeM0/AS1A03_107T01_9000001530cztM0_level2.evt | modeM0/AS1A03_107T01_9000001530cztM0_level2_quad_clean.evt |
| Size (bytes) | 3,242,208,960 | 523,183,680 |
| Size | 3.0 GB | 498.9 MB |
| Events in quadrant A | 21,206,600 | 3,300,373 |
| Events in quadrant B | 27,552,023 | 3,169,058 |
| Events in quadrant C | 20,242,291 | 3,300,556 |
| Events in quadrant D | 26,229,947 | 3,064,833 |
| Mode M0 | |||
|---|---|---|---|
| Quadrant | BADHDUFLAG | Total packets | Discarded packets |
| A | 0 | 92534 | 0 |
| B | 0 | 110037 | 0 |
| C | 0 | 91028 | 0 |
| D | 0 | 106005 | 0 |
| Mode SS | |||
|---|---|---|---|
| Quadrant | BADHDUFLAG | Total packets | Discarded packets |
| A | 0 | 918 | 0 |
| B | 0 | 312 | 0 |
| C | 0 | 925 | 0 |
| D | 0 | 919 | 0 |
| Mode M9 | |||
|---|---|---|---|
| Quadrant | BADHDUFLAG | Total packets | Discarded packets |
| A | 0 | 91 | 0 |
| B | 0 | 91 | 0 |
| C | 0 | 91 | 0 |
| D | 0 | 91 | 0 |
| Quadrant | Total seconds | Saturated seconds | Saturation percentage |
|---|---|---|---|
| A | 44437 | 516 | 1.161195% |
| B | 43300 | 2137 | 4.935335% |
| C | 44472 | 375 | 0.843227% |
| D | 45035 | 831 | 1.845231% |
Noise dominated data is calculated using 1-second bins in cleaned event files. If a bin has >2000 counts, and if more than 50% of those come from <1% of pixels, then it is considered to be noise-dominated and hence unusable.
| Quadrant | # 1 sec bins | Bins with >0 counts | Bins with >2000 counts | High rate bins dominated by noise | Noise dominated (total time) | Noise dominated (detector-on time) | Marked lightcurve |
|---|---|---|---|---|---|---|---|
| A | 54107 | 45632 | 49 | 49 | 0.09% | 0.11% |  |
| B | 54107 | 44513 | 1196 | 1196 | 2.21% | 2.69% | 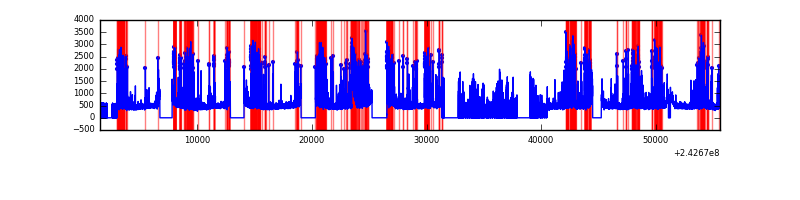 |
| C | 54107 | 45616 | 2 | 2 | 0.00% | 0.00% |  |
| D | 54107 | 45475 | 389 | 389 | 0.72% | 0.86% |  |
Top three noisy pixels from each quadrant. If the there are fewer than three noisy pixels in the level2.evt file, extra rows are filled as -1
| Pixel properties | Quadrant properties | ||||||
|---|---|---|---|---|---|---|---|
| Quadrant | DetID | PixID | Counts | Sigma | Mean | Median | Sigma |
| A | 13 | 251 | 303471 | 280.04 | 5296 | 5198 | 1065.1 |
| A | 1 | 162 | 174965 | 159.39 | 5296 | 5198 | 1065.1 |
| A | 15 | 174 | 151143 | 137.02 | 5296 | 5198 | 1065.1 |
| B | 4 | 239 | 6588297 | 6804.88 | 5135 | 5015 | 967.4 |
| B | 11 | 51 | 284109 | 288.49 | 5135 | 5015 | 967.4 |
| B | 0 | 214 | 222414 | 224.72 | 5135 | 5015 | 967.4 |
| C | 4 | 175 | 50853 | 38.29 | 5162 | 5198 | 1192.3 |
| C | 14 | 234 | 42524 | 31.3 | 5162 | 5198 | 1192.3 |
| C | 13 | 61 | 38610 | 28.02 | 5162 | 5198 | 1192.3 |
| D | 8 | 195 | 2596465 | 2103.43 | 5122 | 4979 | 1232.0 |
| D | 1 | 52 | 2134548 | 1728.51 | 5122 | 4979 | 1232.0 |
| D | 2 | 16 | 1261349 | 1019.76 | 5122 | 4979 | 1232.0 |
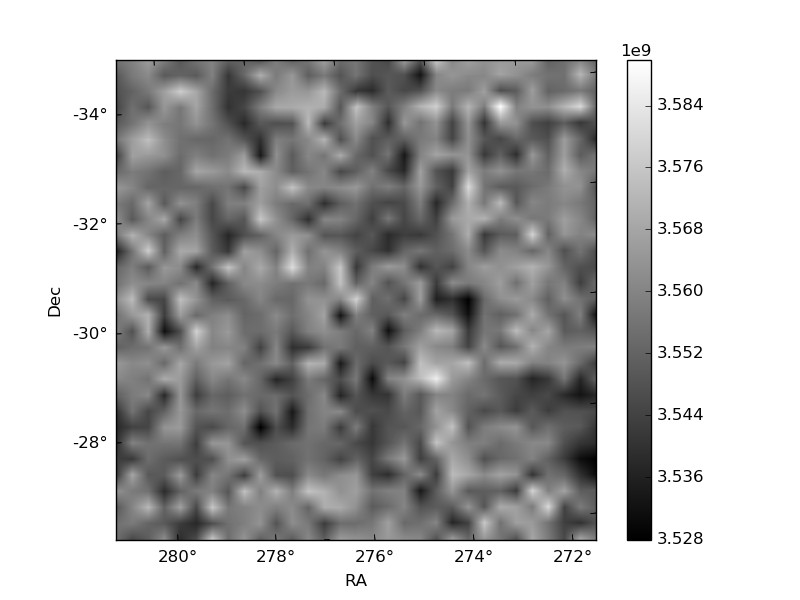
Histogram calculated using DETX and DETY for each event in the final _common_clean file
| Quadrant A |  |
 |
Quadrant B |
|---|---|---|---|
| Quadrant D |  |
 |
Quadrant C |
| Plot type | Count rate plots | Images |
|---|---|---|
| Comparison with Poisson distribution Blue bars denote a histogram of data divided into 1 sec bins. Red curve is a Poisson curve with rate = median count rate of data. |
 |
 |
| Quadrant-wise count rates Data is divided into 100 sec bins |
 |
|
| Module-wise count rates for Quadrant A Data is divided into 100 sec bins |
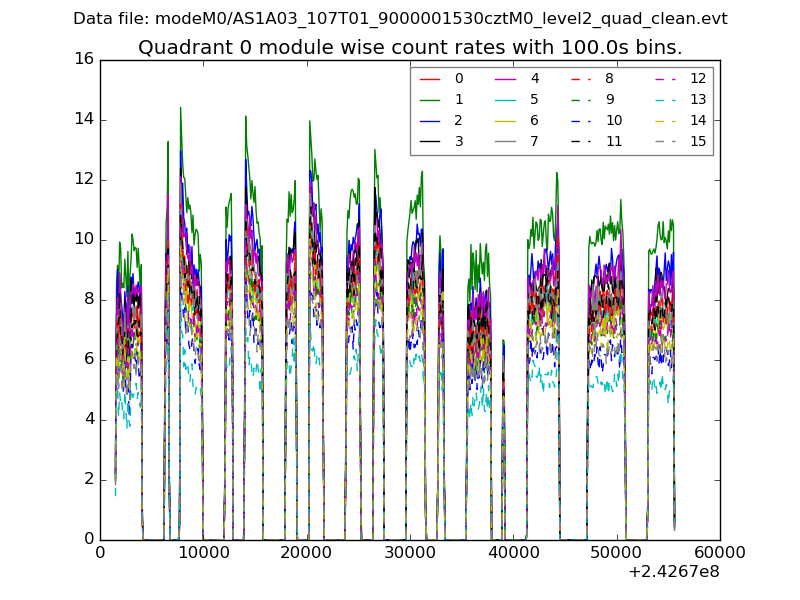 |
 |
| Module-wise count rates for Quadrant B Data is divided into 100 sec bins |
 |
 |
| Module-wise count rates for Quadrant C Data is divided into 100 sec bins |
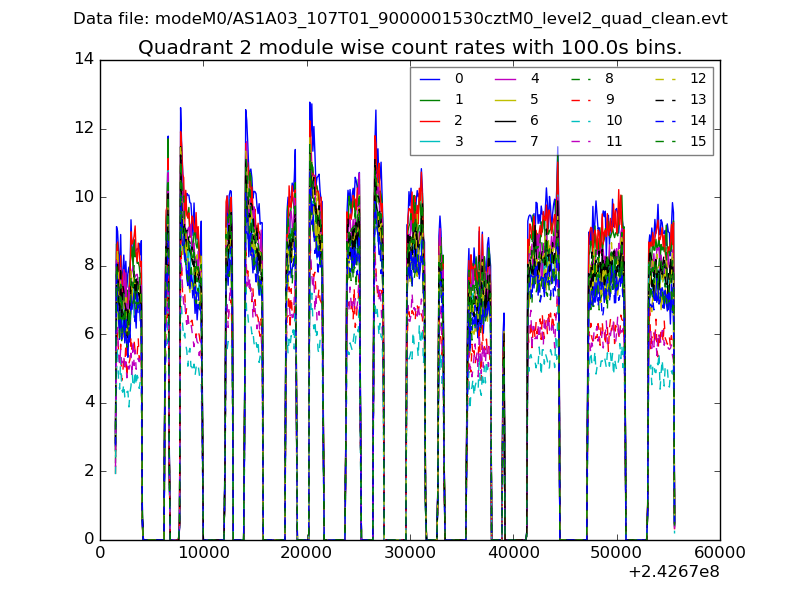 |
 |
| Module-wise count rates for Quadrant D Data is divided into 100 sec bins |
 |
 |
| Parameter | Plot |
|---|---|
| CZT HV Monitor | 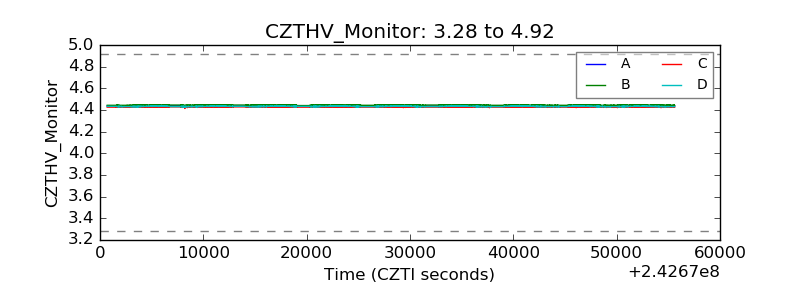 |
| D_VDD |  |
| Temperature 1 |  |
| Veto HV Monitor |  |
| Veto LLD |  |
| Alpha Counter |  |
| _CPM_Rate |  |
| CZT Counter |  |
| +2.5 Volts monitor |  |
| +5 Volts monitor |  |
| _ROLL_ROT |  |
| _Roll_DEC |  |
| _Roll_RA |  |
| Veto Counter |  |